- The Greenback is gaining steam this Friday as the market is rising to weekly tops.
- The level to beat for buyers is the 98.55/98.68 resistance zone.
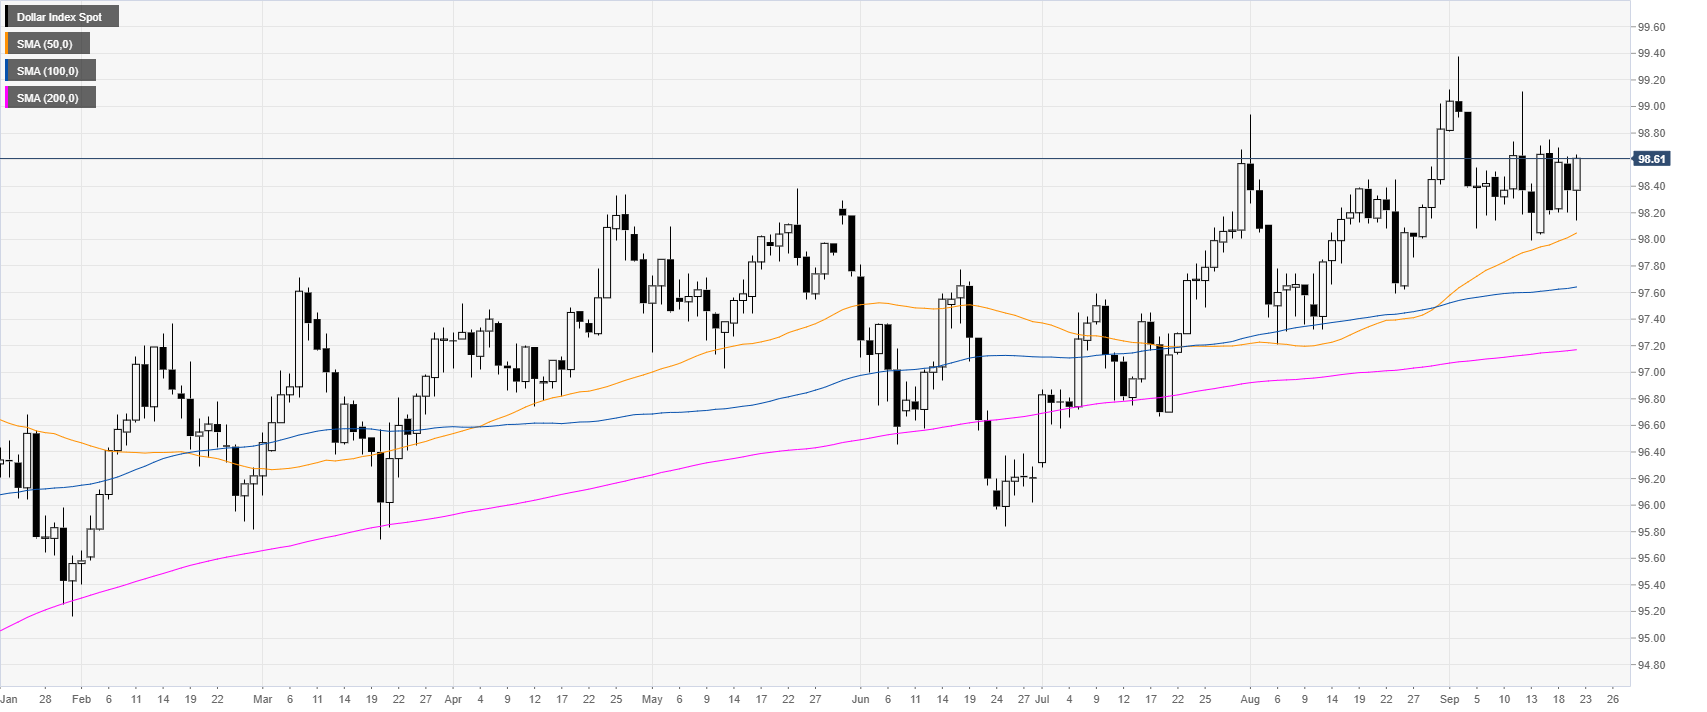
DXY daily chart
DXY (US Dollar Index) is trading in a bull trend above its main daily simple moving averages (DSMAs). The Greenback, in the last two weeks, has been trading in a trading range around the 98.40 level.
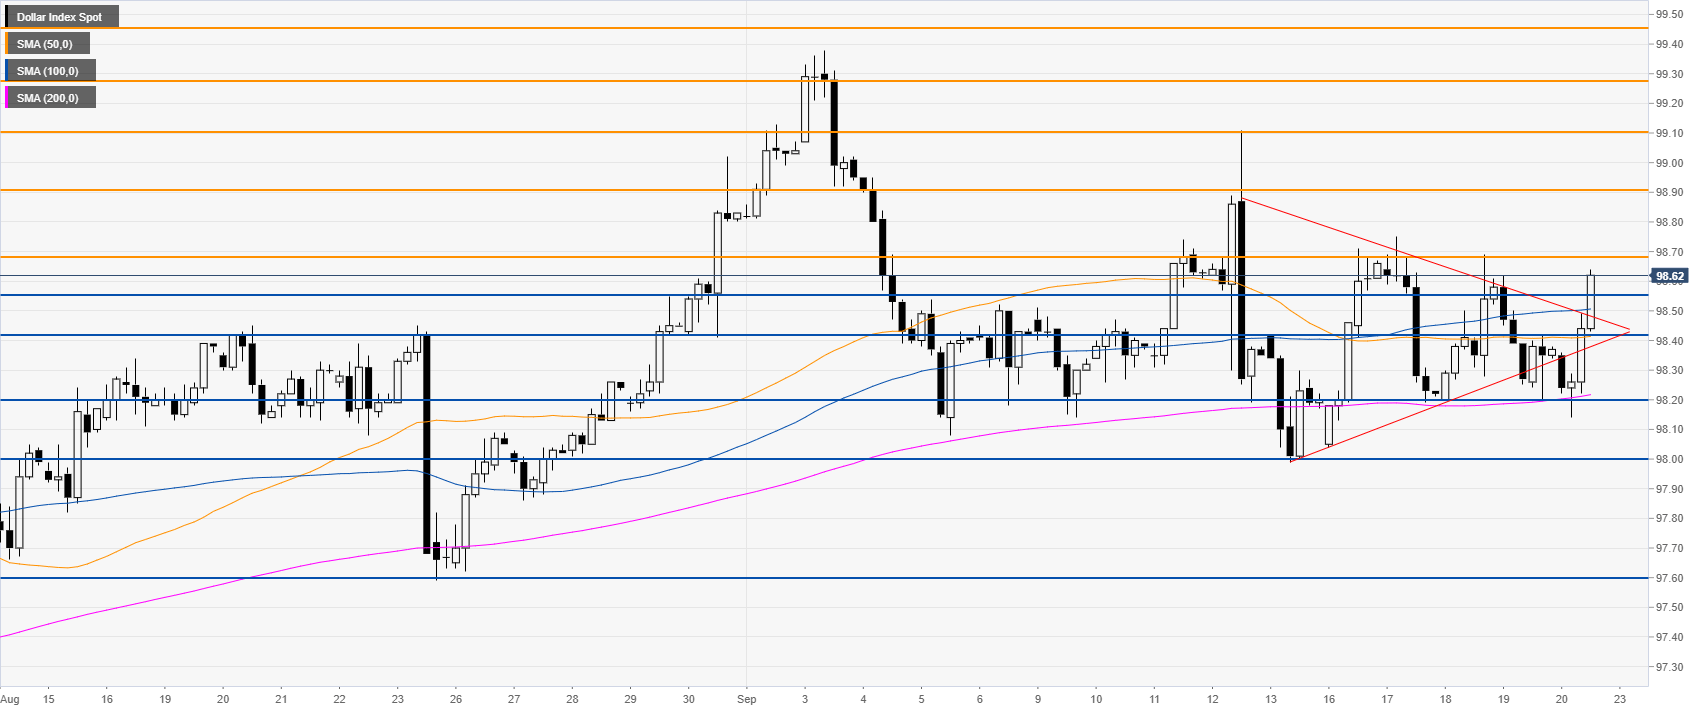
DXY four-hour chart
DXY is trading above the primary SMAs, suggesting bullish momentum. The market is gaining strength as it broke above the triangle pattern. However, buyers will need to defend the 98.42 and 98.20 support if they don’t want the market to stay stuck in the range. The Greenback would need a daily close above 98.68 to pull away from the current range.
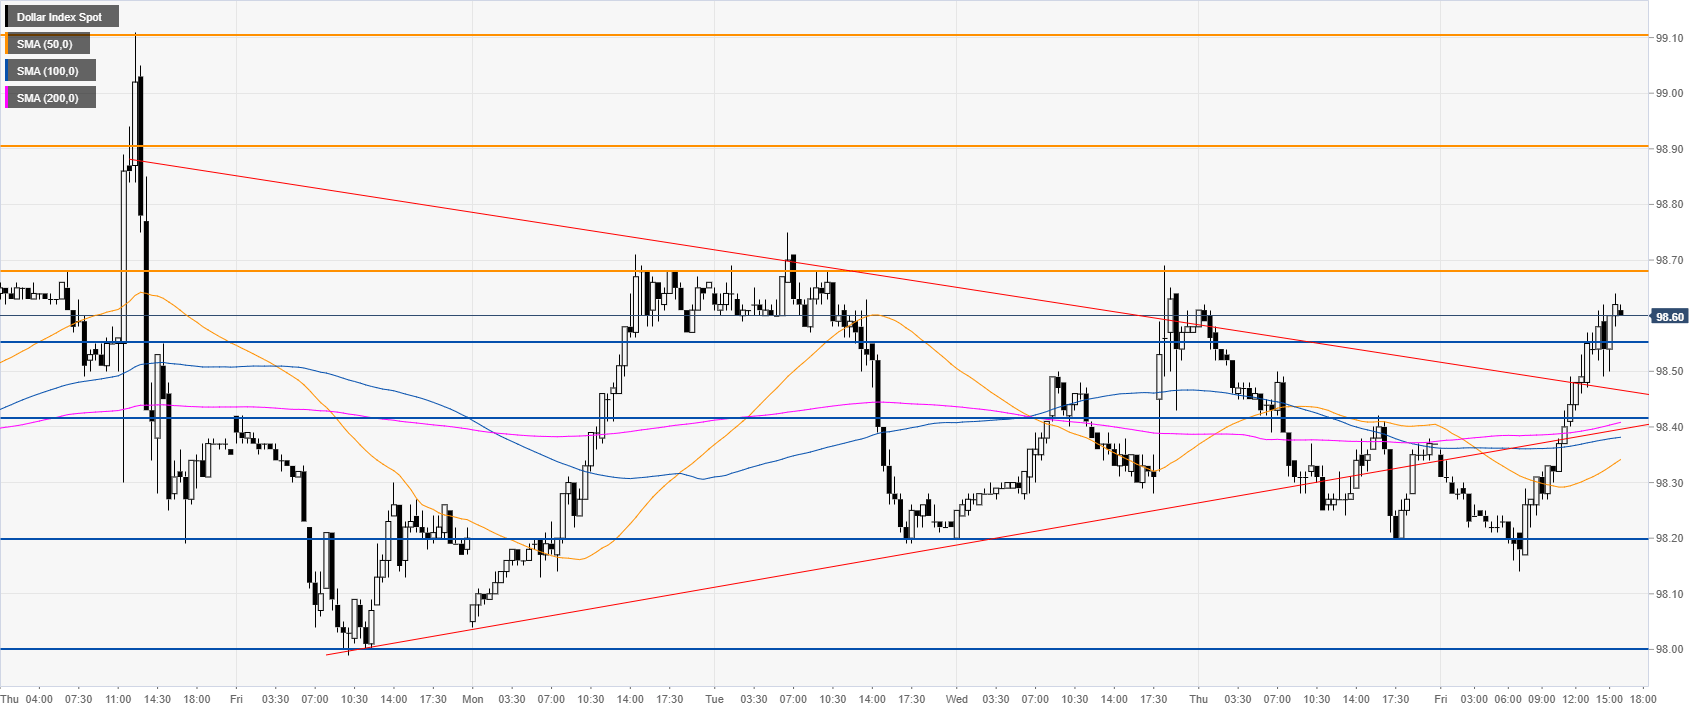
DXY 30-minute chart
DXY is trading above the main SMAs, suggesting bullish momentum in the near term. Support is seen at the 98.55 and 98.42 price levels.
Additional key levels
