- AUD/JPY stays under near-term key resistance-confluence after Aussie PMI data.
- September month activity numbers from Commonwealth Bank flashes mixed results.
- Bearish MACD favors pair’s further declines.
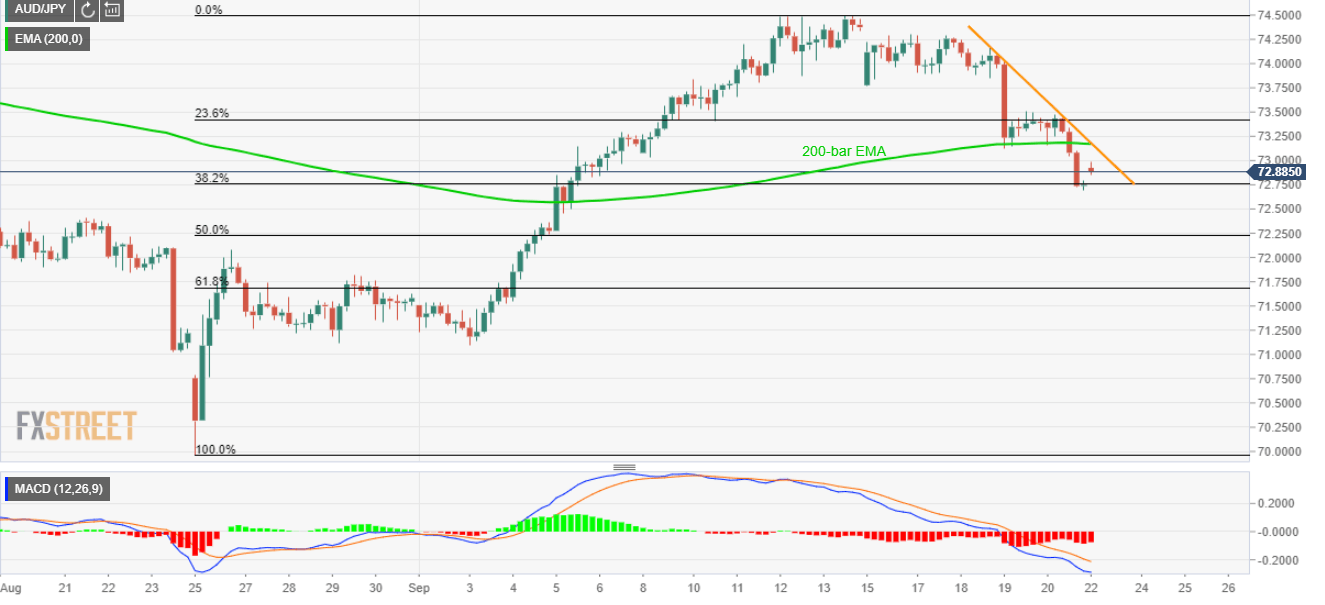
With the key preliminary purchasing manager indices (PMI) from the Commonwealth Bank flashing mixed signals, AUD/JPY remains on the back foot while taking rounds to 72.87 during the early Asian session on Monday.
While the headline Manufacturing PMI slipped below 50.9 forecast to 49.4, Services PMI crossed 45.3 expectations with 52.5 level whereas Composite PMI rose above 49.3 prior to 51.9.
The 200-bar exponential moving average (EMA) and a three-day-old falling trend-line together constitute 73.15/20 as a near-term key resistance-confluence. Also exerting the downside pressure is the bearish signal from 12-bar moving average convergence and divergence (MACD) indicator.
With this, the quote is likely declining towards 72.70 and 50% Fibonacci retracement of August-September upside, around 72.20. However, August 29 high near 71.80 and September month bottom close to 71.15/10 could restrict the pair’s additional south-run.
Alternatively, pair’s run-up beyond 73.20 enables it to question mid-month low surrounding 73.80 while seeking to visit 74.00 round-figure and a monthly high around 74.50.
AUD/JPY 4-hour chart
Trend: bearish
