- USD/CNH confronts 61.8% Fibonacci retracement of its September 06 swing high to September 13 swing low.
- 200-HMA, 1-week-old support-line restricts pair’s immediate declines.
- A horizontal-line since September 09 becomes the key upside barrier.
Even after failing to clear September 09 high, USD/CNH stays above an important support-confluence while trading near 7.1086 during early Monday.
Considering the pair’s sustained trading beyond key support, another attempt to clear 7.1310/20 horizontal region including recent highs can’t be denied.
Should prices remain strong beyond 7.1320, September 06 high near 7.1480 will become buyers’ favorite.
Alternatively, pair’s break below 7.0830 support-confluence including 200-hour moving average (HMA) and near-term rising trend-line highlights the importance of 23.6% Fibonacci retracement, at 7.0600, as a consecutive rest-point, breaking which 7.0400 and 7.0350 could entertain sellers.
In a case where selling pressure remains intact below 7.0350, monthly bottom surrounding 7.0310 and August 13 low close to 7.0000 round-figure could be targeted if holding short positions.
USD/CNH hourly chart
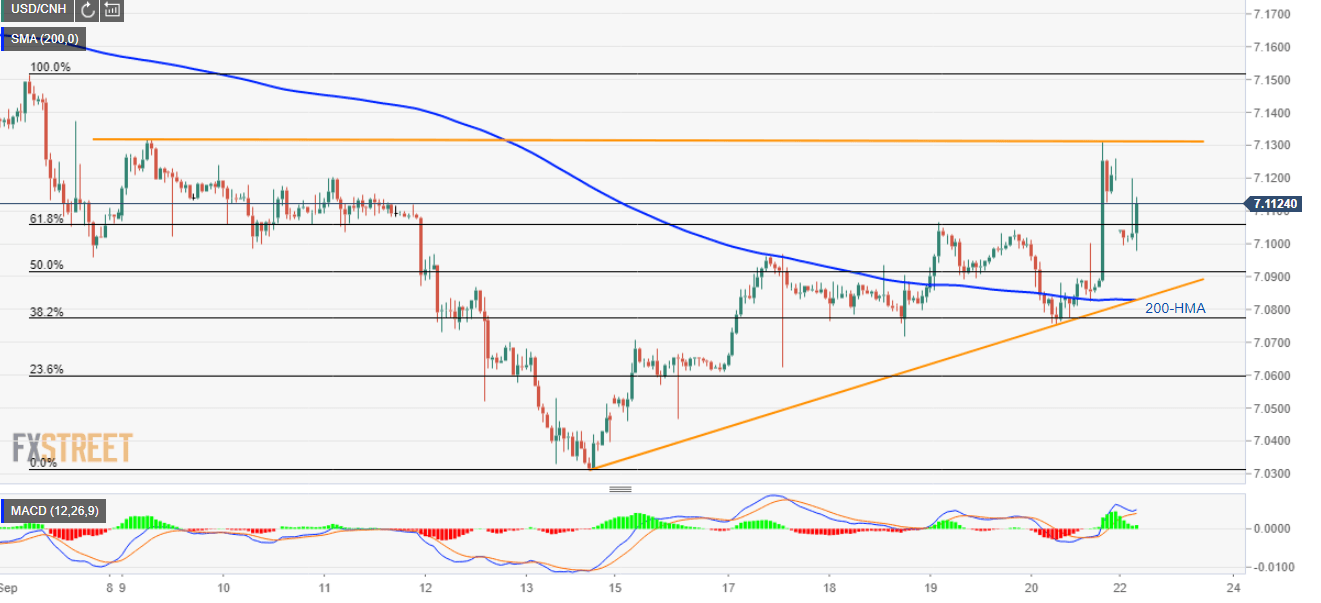
Trend: sideways
