- USD/JPY is losing steam as the market is dropping from September highs.
- The level to beat for bears is the 107.22 support level.
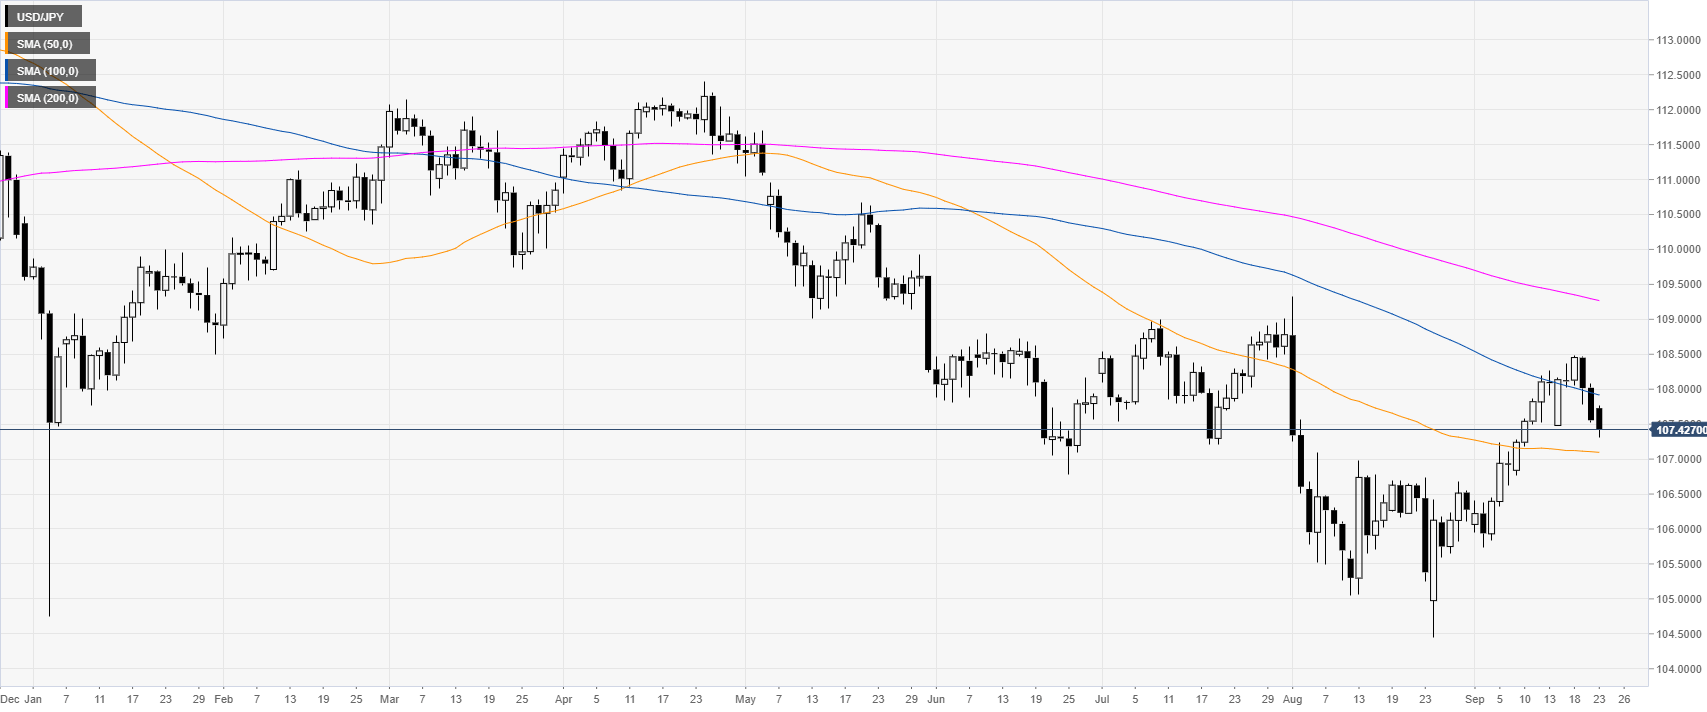
USD/JPY daily chart
USD/JPY is in a downtrend below the 100/200-day simple moving averages (SMA). The market is retreating down from the September highs.
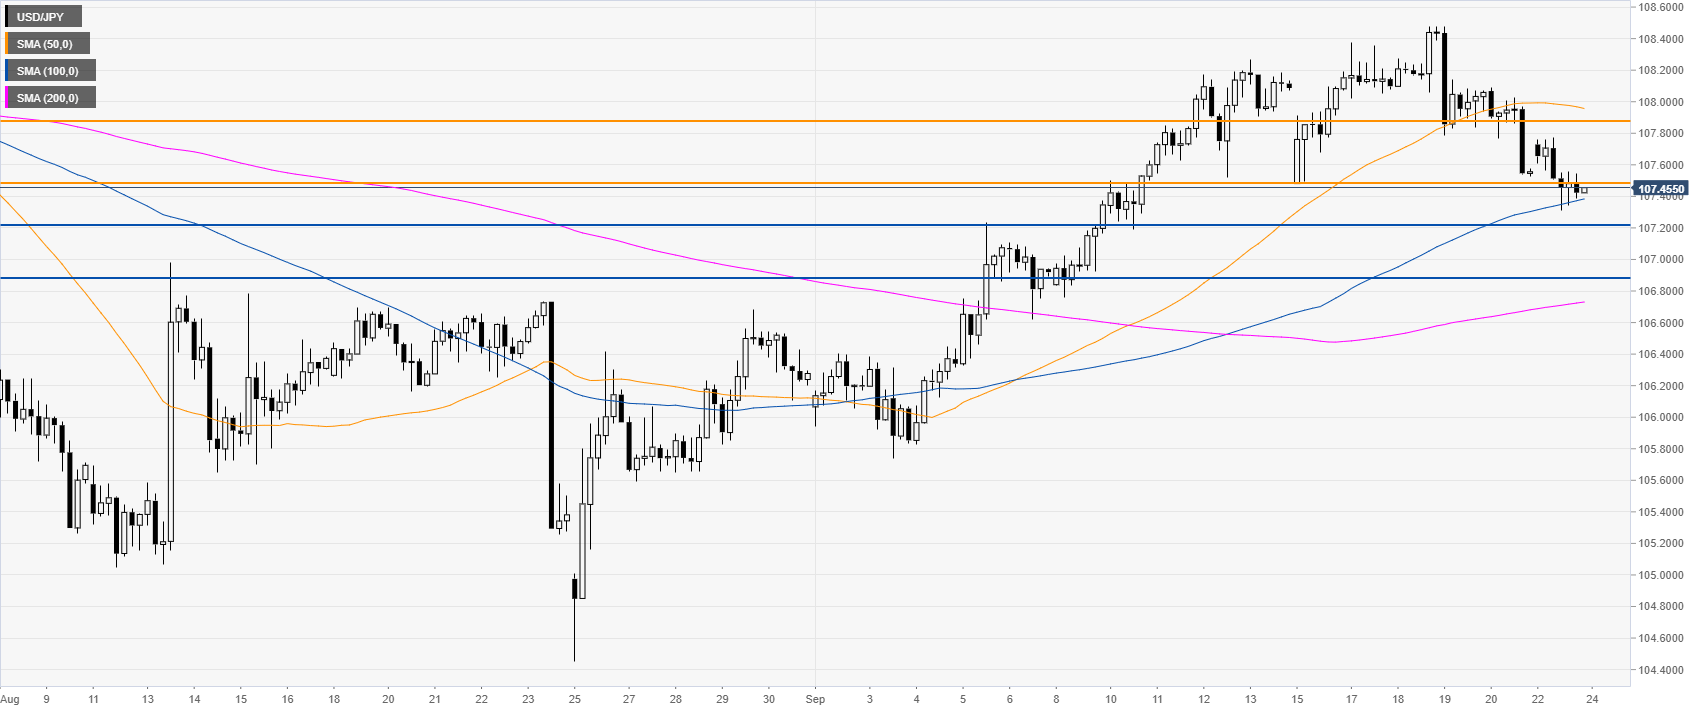
USD/JPY 4-hour chart
USD/JPY is trading between the 50 and 100 SMAs, suggesting a consolidation down in the medium term. A break of 107.22 to the downside can expose 106.88 support, according to the Technical Confluences Indicator.
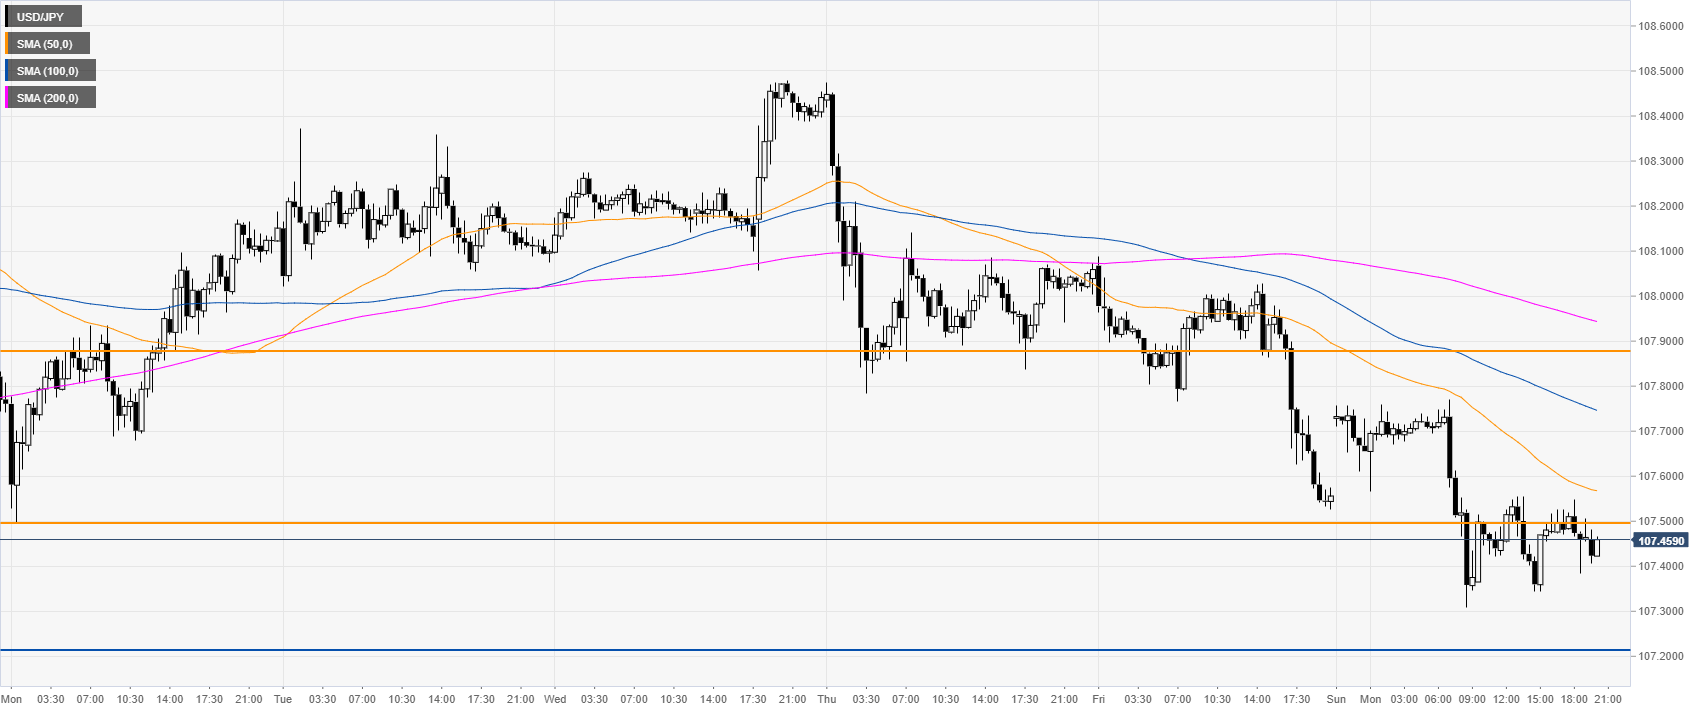
USD/JPY 30-minute chart
Dollar/Yen is trading below its main SMAs, suggesting a bearish bias in the near term. Immediate resistances are seen at the 107.50 and 107.88 price levels, according to the Technical Confluences Indicator.
Additional key levels
