- EUR/USD is easing from daily highs in the New York session.
- The level to beat for sellers is the 1.0965 support level.
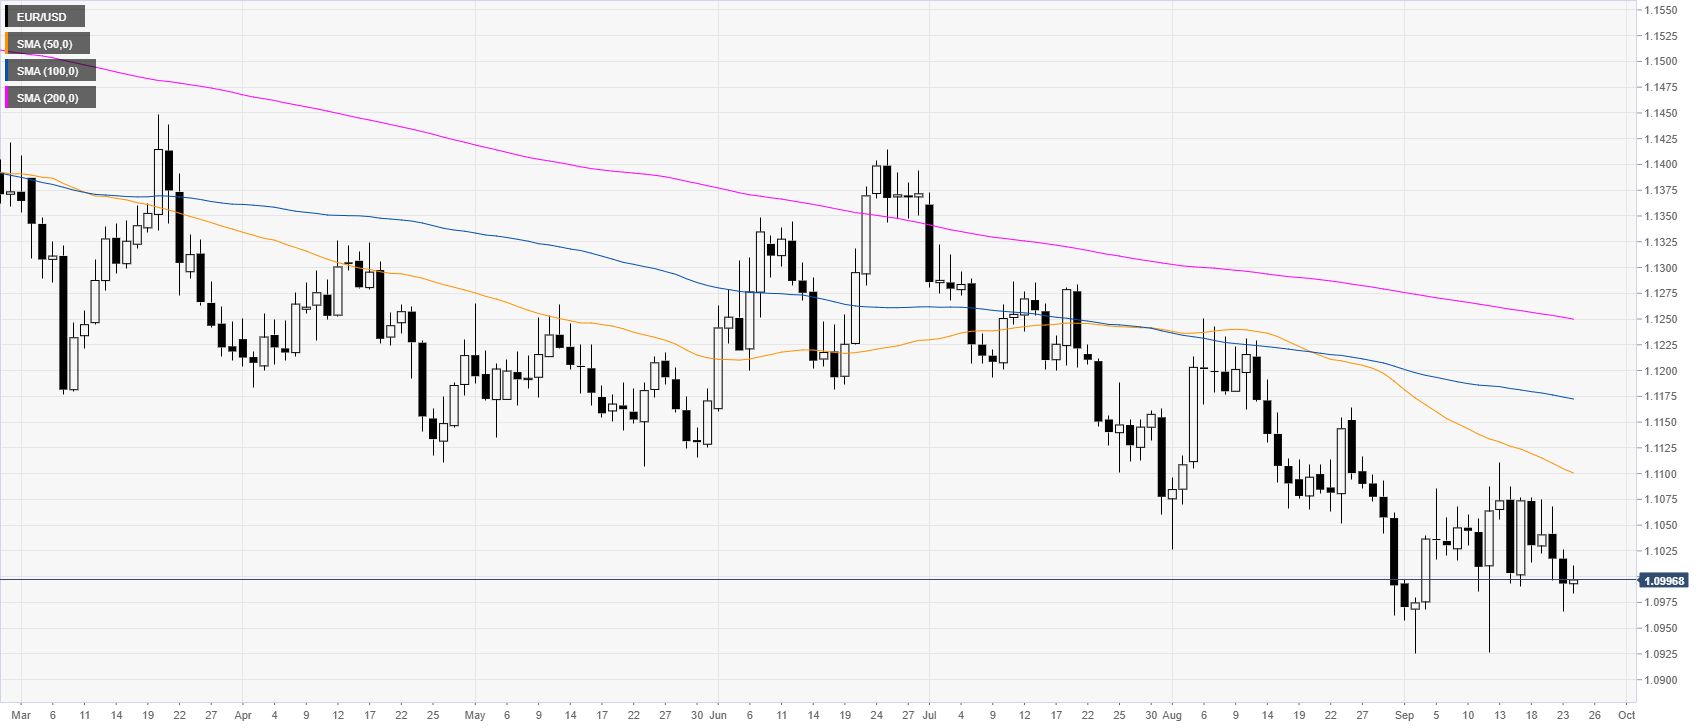
EUR/USD daily chart
On the daily chart, the shared currency is trading in a downtrend below its main daily simple moving averages (DSMAs). In the European session, the German IFO came above expectation, but without any firework on the EUR.
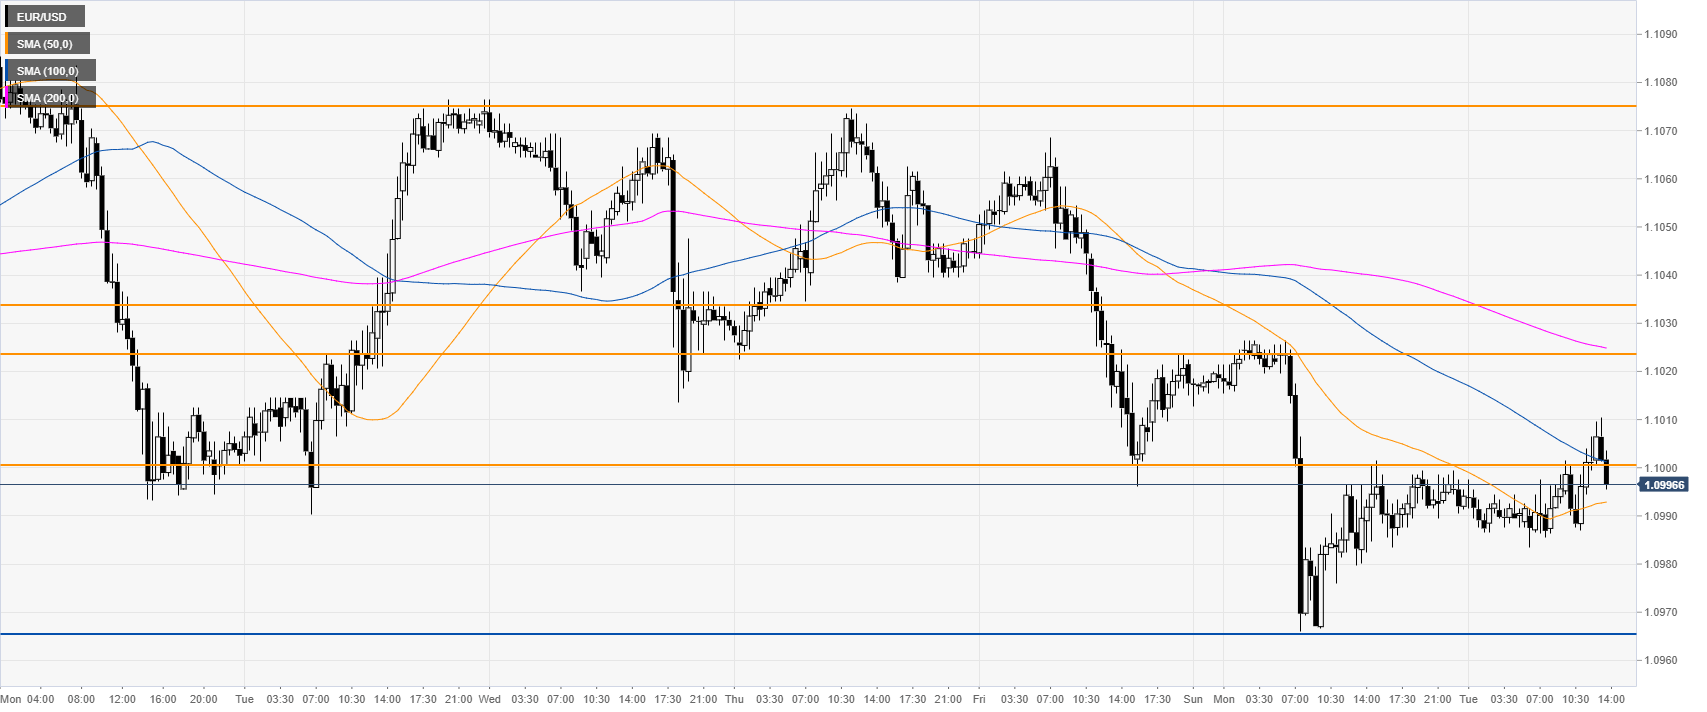
EUR/USD four-hour chart
EUR/USD is trading below its main SMAs, suggesting a bearish bias in the medium term. To the downside, a break of the 1.0965 support (current weekly low) can expose 1.0940 (near the 2019 low) and 1.0887 price level, according to the Technical Confluences Indicator.

EUR/USD 30-minute chart
The Fiber is challenging the 1.1000 figure and the 100 SMA, suggesting a consolidation in the near term. A daily close above 1.1000 can expose the 1.1023/35 resistance zone and the 1.1075 price level, according to the Technical Confluences Indicator.
Additional key levels
