- GBP/USD struggles around 23.6% Fibonacci retracement as 4H 50MA limits the upside.
- A two-week-old rising trend-line, horizontal-support can offer nearby rest.
With the 50-bar moving average on the four-hour chart (4H 50MA) aptly restricting the GBP/USD pair’s immediate upside, the quote stays on the back foot while flashing 1.2430 amid initial Asian trading session on Tuesday.
An upward sloping trend-line and horizontal support since September 09, around 1.2393/85, act as immediate key support as the break of which can fetch prices further south towards 1.2230 and 61.8% Fibonacci retracement level of current month upside, around 1.2200.
Alternatively, the pair’s rise beyond 4H 50MA level of 1.2450 can have multiple resistances between 1.2500 and 1.2530.
Should there be additional upside past-1.2510, recent high surrounding 1.2580 and 1.2600 could lure buyers.
GBP/USD 4-hour chart
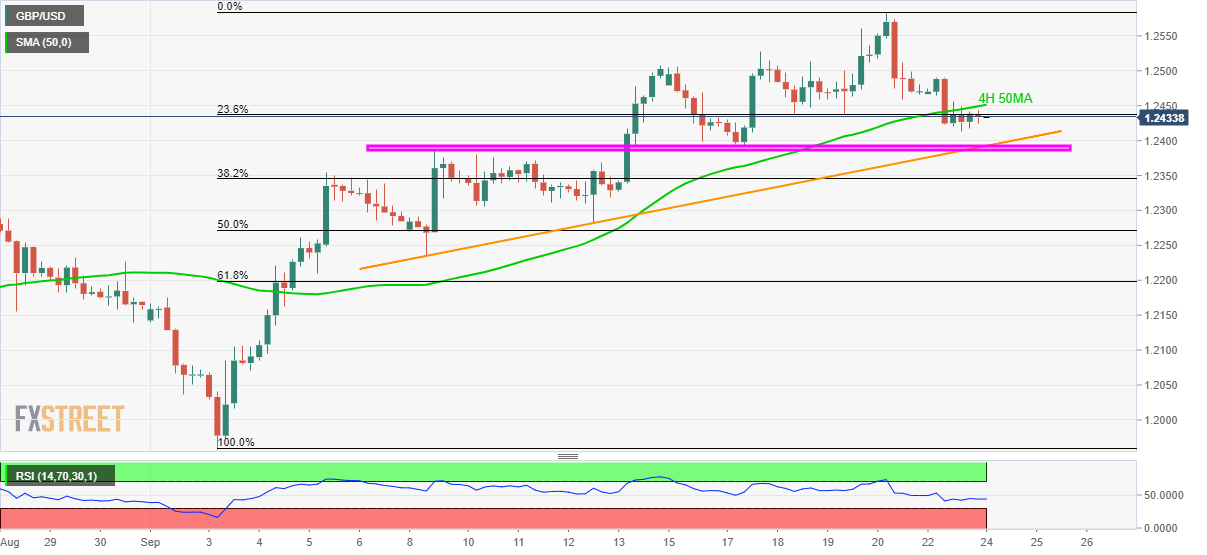
Trend: sideways
