- GBP/USD sustains trading below 200-HMA.
- 61.8% Fibonacci retracement level, 1.2370 offer strong support to prices.
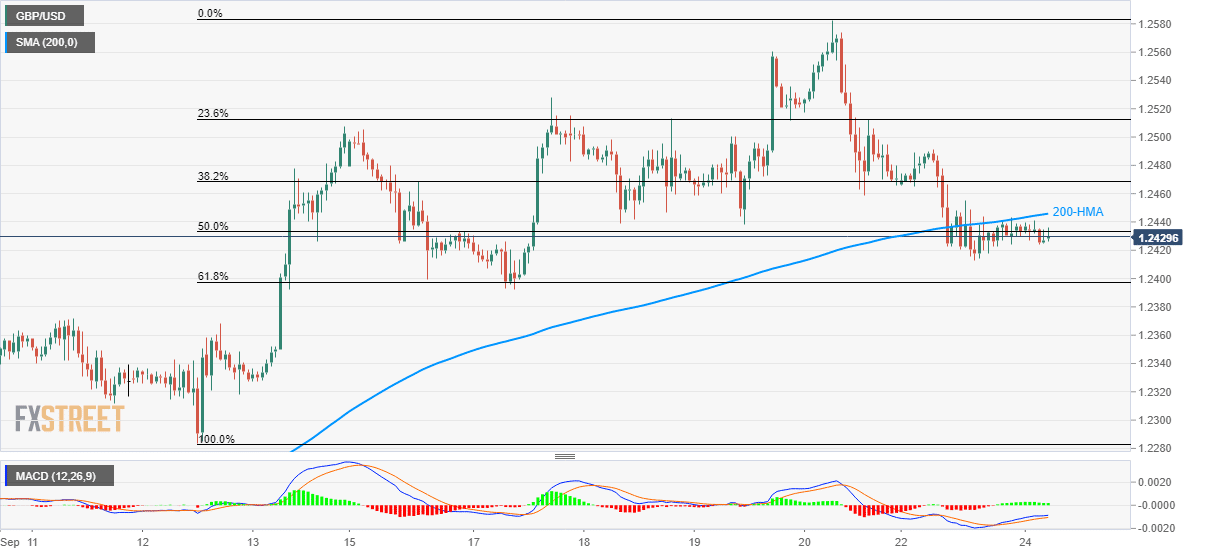
GBP/USD extends trading below 200-hour simple moving average (HMA) while taking rounds to 1.2435 ahead of the UK open on Tuesday.
61.8% Fibonacci retracement of September 12-20 upside, around 1.2400, becomes the nearby key support to watch during pair’s further declines, a break of which opens the door for a slump towards September 11/12 tops nearing 1.2370.
In a case where prices keep trading southwards past-1.2370, 1.2310 and 1.2280 could please sellers.
Alternatively, pair’s break above 200-HMA level of 1.2455 can challenge Monday’s high surrounding 1.2490 and 23.6% Fibonacci retracement close to 1.2510.
Also, the successful rise above 1.2510 enables buyers to aim for monthly top, at 1.2582, ahead of watching over the 1.2600 round-figure.
GBP/USD hourly chart
Trend: bearish
