- USD/INR extends south-run below 50-day EMA.
- Bearish MACD favors further weakness towards 70.50/45 support-area.
Despite bouncing off recently, USD/INR stays below the short-term key exponential moving average (EMA) while taking rounds to 70.80 prior to the European session open on Tuesday.
Also confirming the pair’s downside is a bearish signal from the 12-bar moving average convergence and divergence (MACD) indicator.
However, 100-day EMA and 50% Fibonacci retracement of July-September advances around 70.50/45 seems to challenge the sellers, failing to which can quickly drag prices to 61.8% Fibonacci retracement near 69.90 and then to July tops close to 69.40.
On the upside, a successful closing beyond 50-day EMA level of 70.90 will find multiple resistances around 71.40 that hold the gate to the pair’s run-up towards 72.30 and recent highs adjacent to 72.65.
USD/INR daily chart
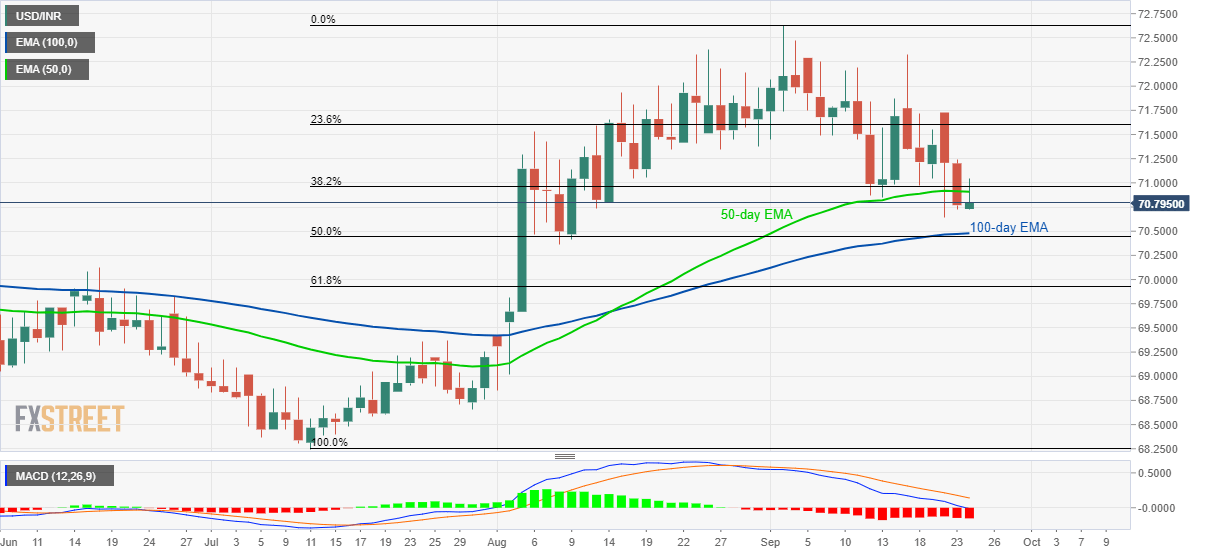
Trend: pullback expected
