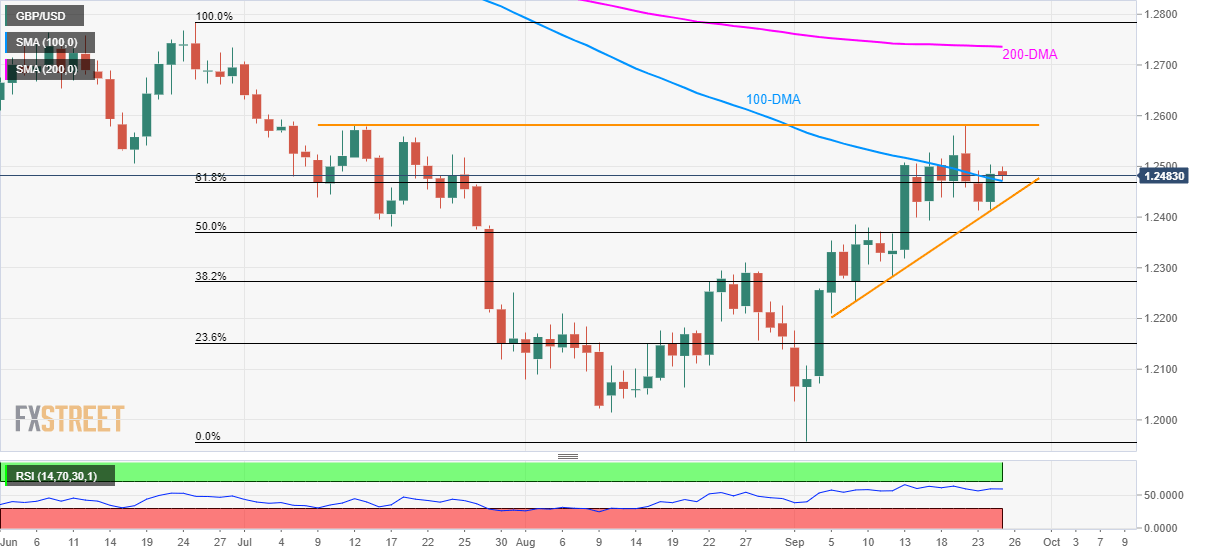
- GBP/USD successfully trades above 100-DMA, 61.8% Fibonacci retracement of June-September decline.
- A two-week-old rising trend-line adds to the support while 1.2580/83 becomes nearby resistance.
Following its run-up on Tuesday, GBP/USD successfully trades above near-term key support-confluence as it seesaws near 1.2485 during the Asian session on Wednesday.
With the strong read of 14-day relative strength index (RSI) and a sustained break of 1.2471/67 area including 100-day simple moving average (DMA) and 61.8% Fibonacci retracement, prices are likely to extend the latest upside.
In doing so, a horizontal region including mid-July tops and the current month high, around 1.2580/83, can become buyers’ first choice ahead of confronting late-June low near 1.2660 and 200-DMA level of 1.2735.
Meanwhile, a downside break of 1.2467 can’t be considered as a bearish signal as a two-week-old rising trend-line, at 1.2428, also stands tall to challenge sellers.
Should pair’s weakness defy 1.2428 support, 1.2385/80 and 50% Fibonacci retracement around 1.2370 will flash on bears’ radar.
GBP/USD daily chart
Trend: bullish
