- GBP is under heavy pressure near two-week’s lows.
- The level to beat for sellers is the 1.2330 support.
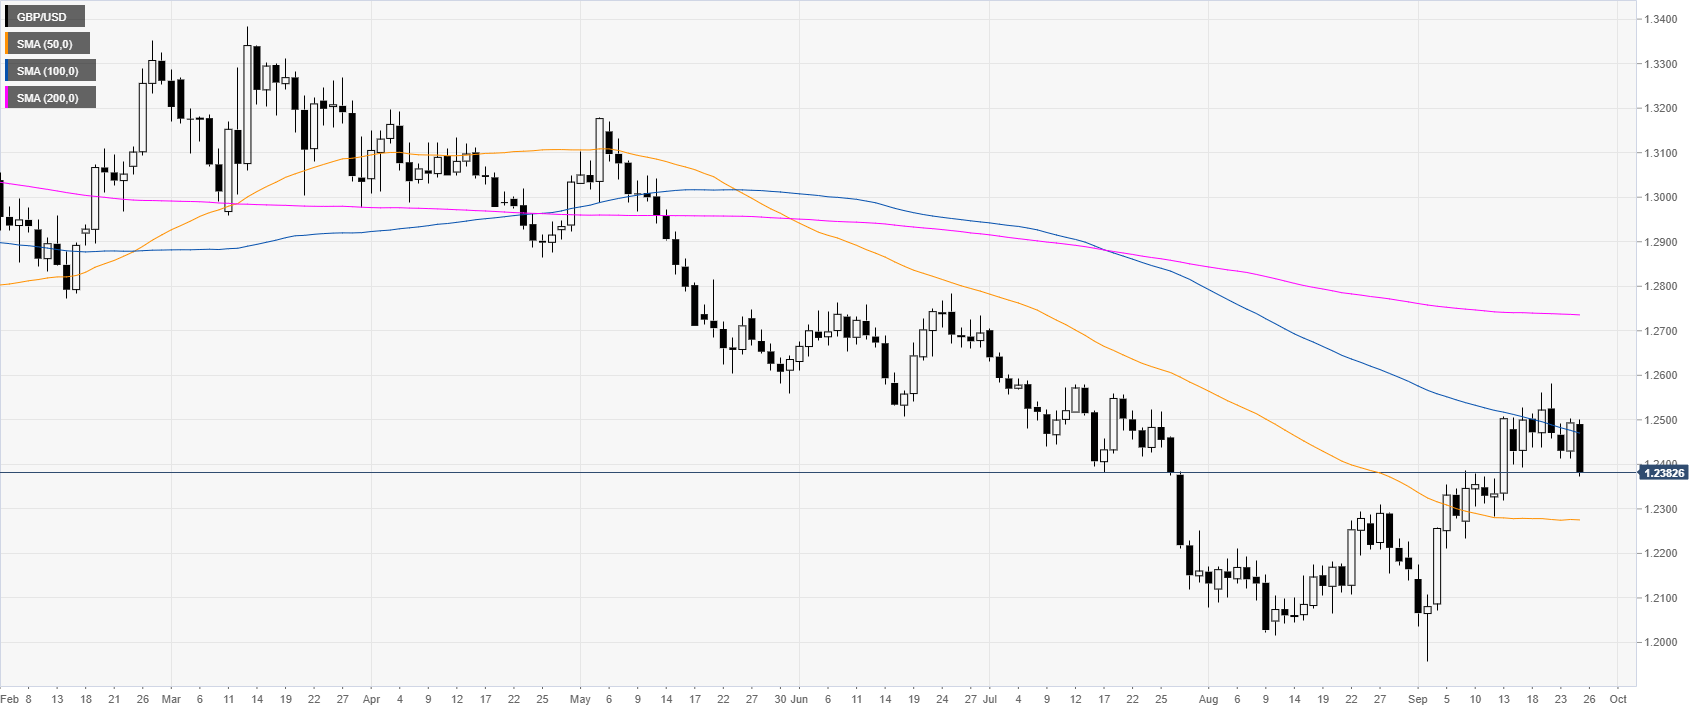
GBP/USD daily chart
The Sterling is trading is trading in a bear trend below the 100 and 200-day simple moving averages (SMAs).
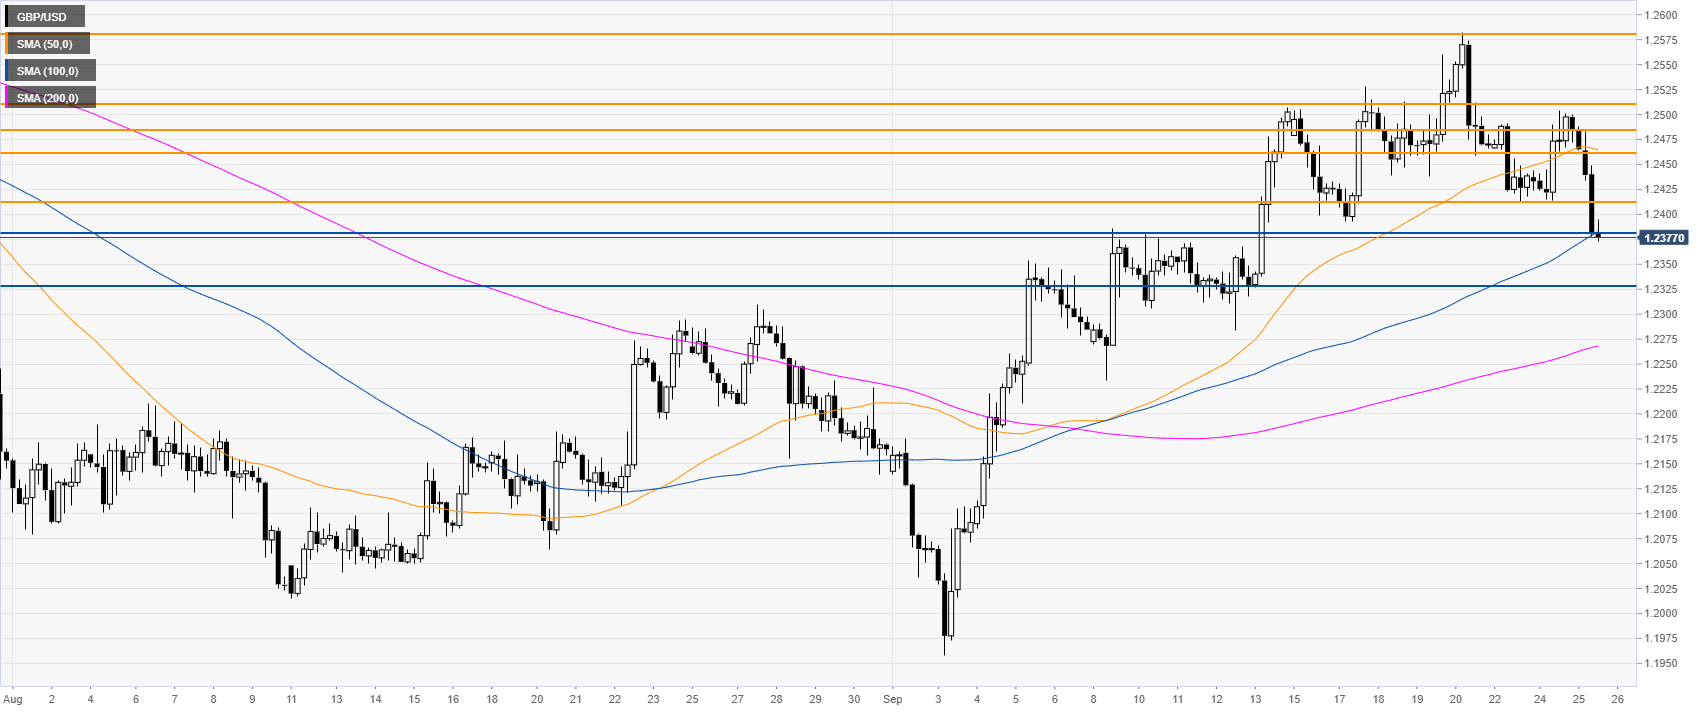
GBP/USD four-hour chart
The market is challenging the 100 SMA near the 1.2380 price level. A break of thi level to the downside can expose the 1.2330 support level, according to the Technical Confluences Analysis.
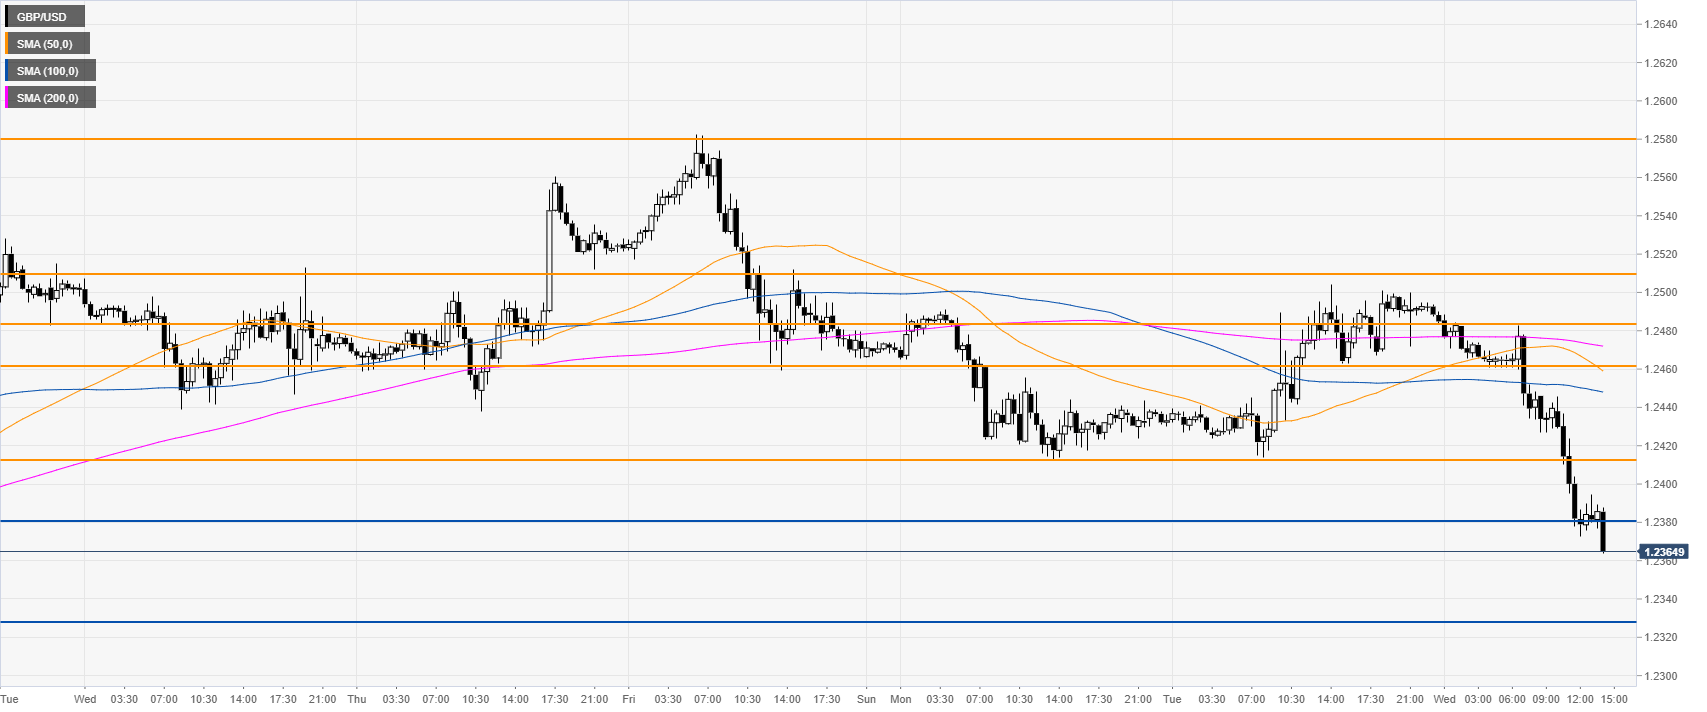
GBP/USD 30-minute chart
The market is under pressure near two week’s lows. Immediate resistance is seen at the 1.2410 level followed by the 1.2460 level.
Additional key levels
