- USD/CAD bounces off 100-bar SMA following a Doji on 4H chart.
- Early-month low, last-week high restrict pair’s near-term advances.
Having flashed a Doji candle on the four-hour (4H) chart, USD/CAD bounces off 100-bar simple moving average (SMA) as it trades near 1.3250 during early Wednesday.
Following a bullish reversal candlestick pattern, coupled with a U-turn from key SMA, the quote is expected to rise further towards 1.3280 and 61.8% Fibonacci retracement of current month declines, near 1.3290.
However, pair’s additional upside will be questioned by a horizontal region comprising Early-month low and last week’s high, around 1.3310/15.
On the contrary, 1.3210 and 23.6% Fibonacci retracement near 1.3190 can entertain sellers ahead of challenging them with 1.3150, 1.3130 and 1.3080 consecutive rest-points.
USD/CAD 4-hour chart
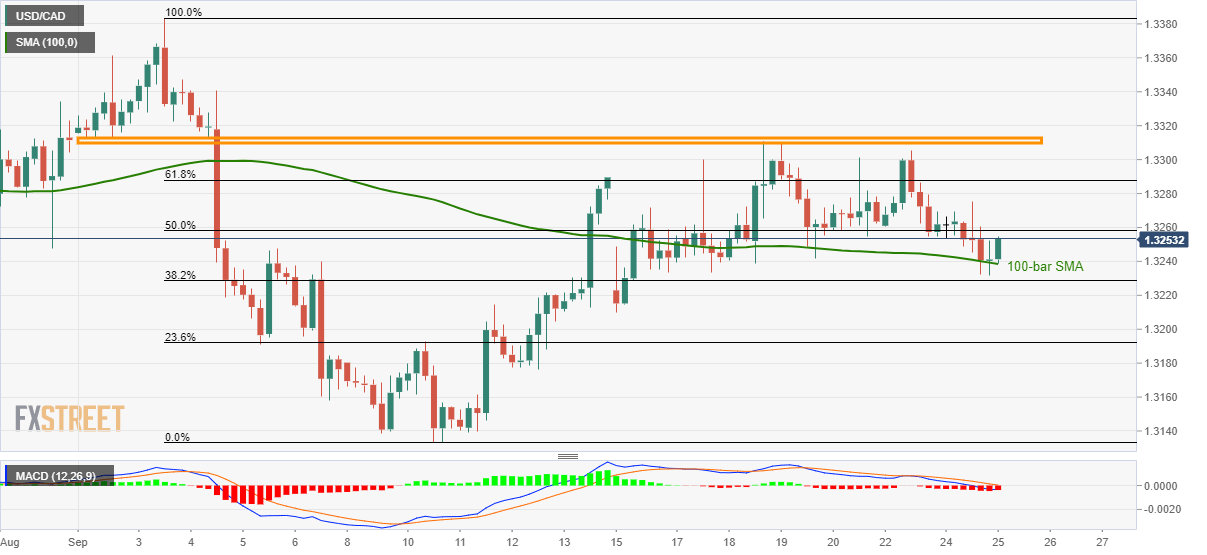
Trend: sideways
