- USD/IDR follows three-week-old ascending triangle formation on the four-hour chart.
- Bullish MACD increases the odds for the pair’s run-up to 14,350/60 multiple resistance-zone.
Despite witnessing another pullback from 14,188/90 area, USD/IDR stays inside a short-term bullish triangle formation while trading around 14,135 ahead of the European session on Wednesday.
Not only price-positive chart pattern but the bullish signal from 12-bar moving average convergence and divergence (MACD) indicators also favors the pair’s upside.
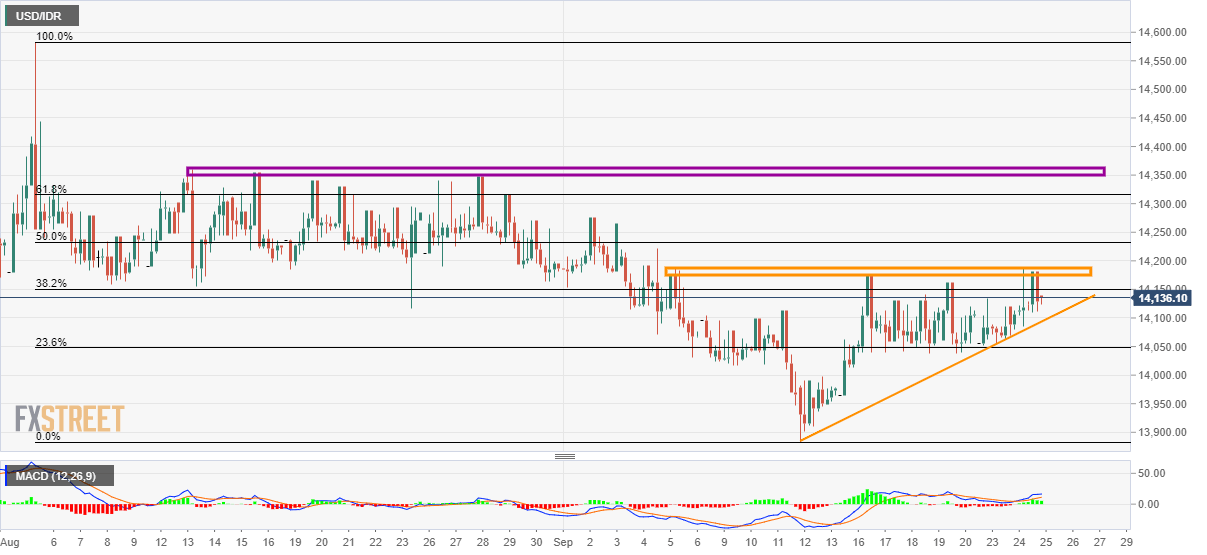
In doing so, the quote needs a successful break above pattern resistance, surrounding 14,188/90, which in turn will trigger fresh rise to early-month highs nearing 14,280. Though, pair’s sustained advances past-14,280 will not hesitate challenging a six-week-old horizontal resistance-zone around 14,350/60.
Alternatively, pair’s declines below pattern support of 14,090 can recall 14,000 whereas monthly bottom close to 13,880 will entertain bears then after.
USD/IDR 4-hour chart
Trend: recovery expected
