- EUR/USD is bouncing up after disappointing US data.
- The market is now trading at fresh daily highs.
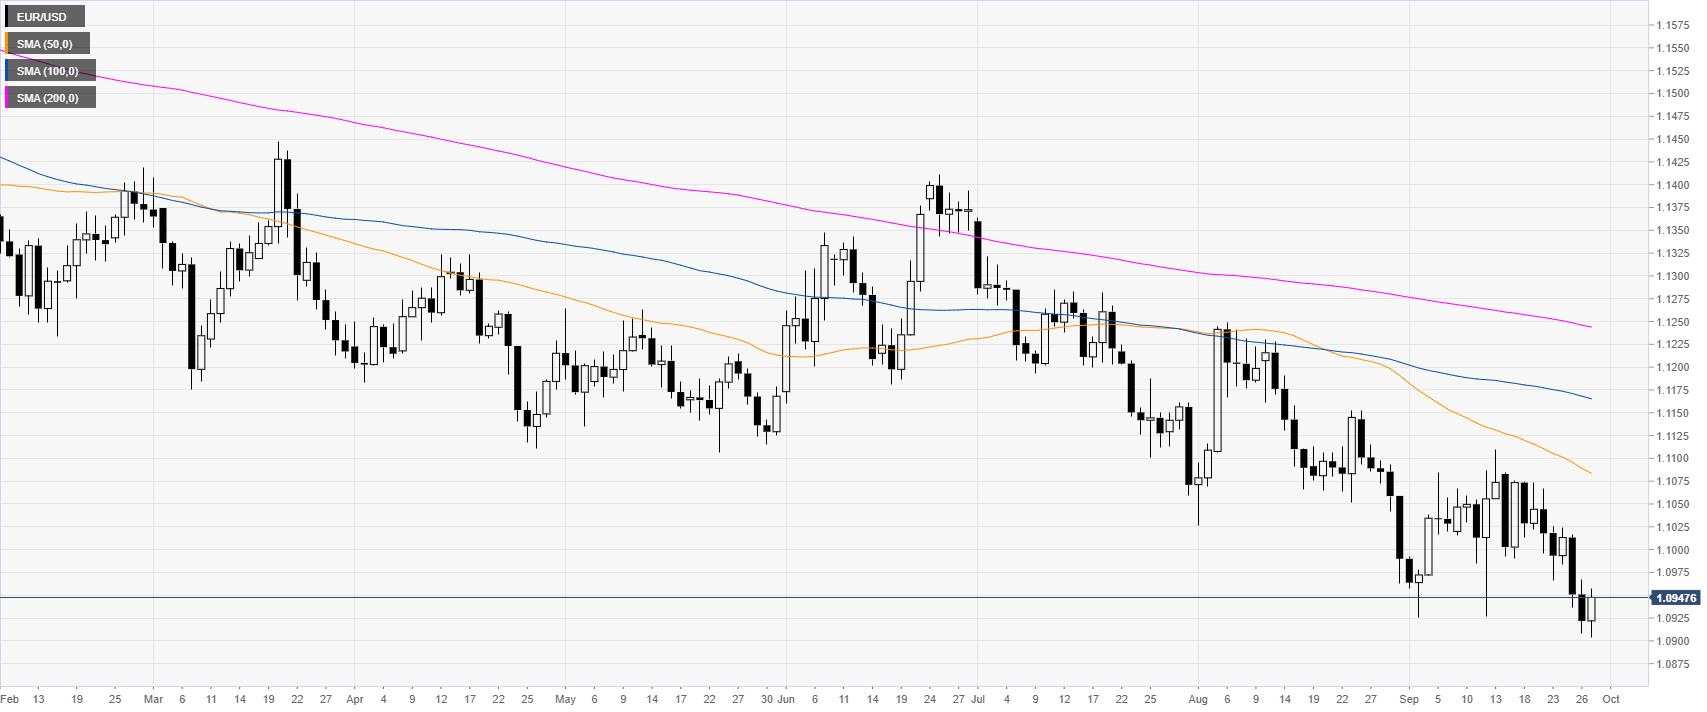
EUR/USD daily chart
On the daily chart, the common currency is trading in a bear trend below the main daily simple moving averages (DSMAs). Earlier in the New York session, the Nondefense Capital Goods Orders Excluding Aircraft (August) in the United States, came in below expectations at -0.2 vs. 0% forecast. On the other hand, the Core Personal Consumption Expenditure YoY came in line with expectations at 1.8% in August.
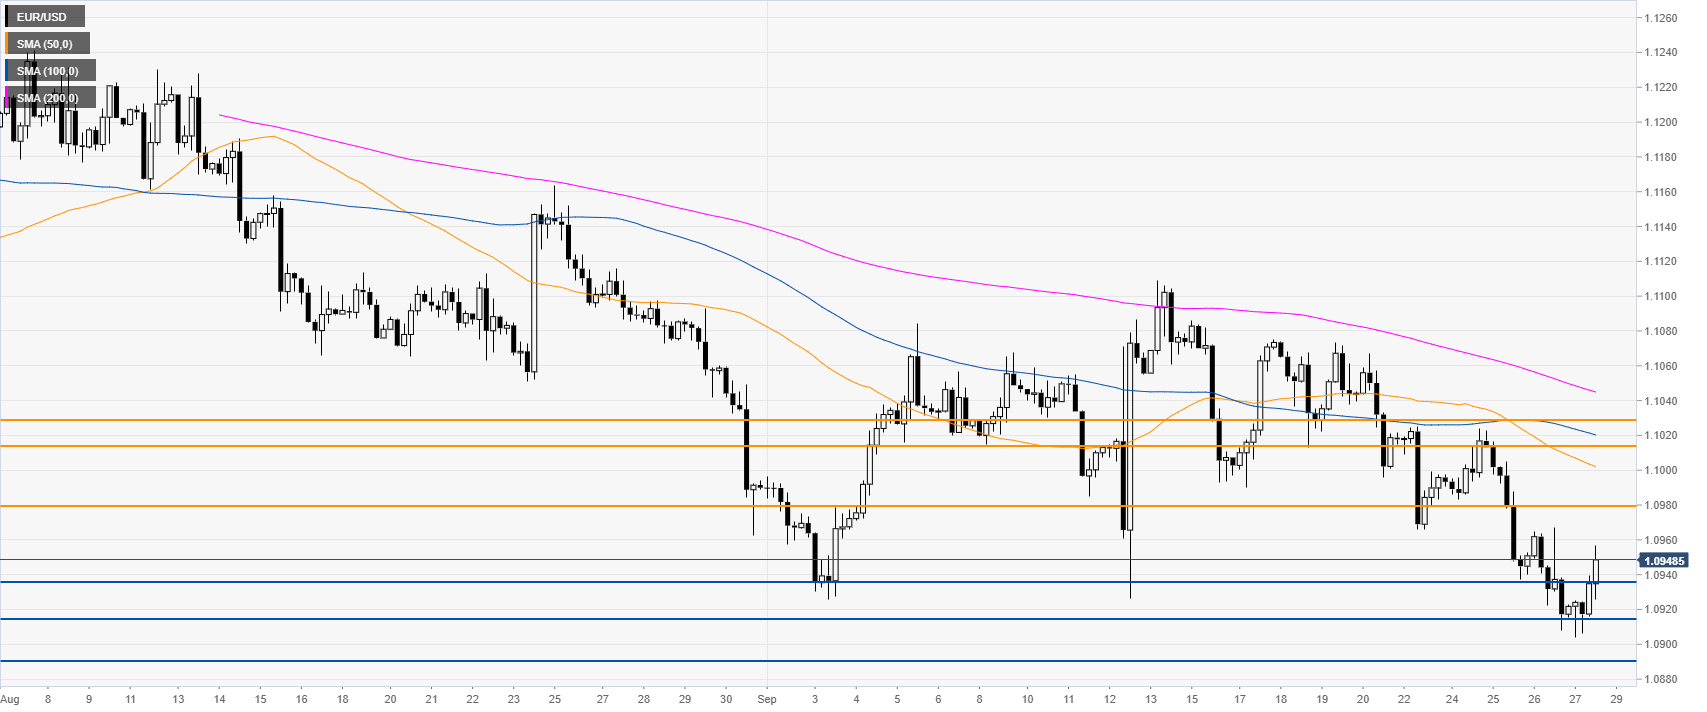
EUR/USD four-hour chart
EUR/USD broke above the 1.0935 resistance after the disappointing data in the United States. The next main resistance to the upside is at the 1.0980 level. Support is seen at the 1.0935 and 1.0914 price levels.
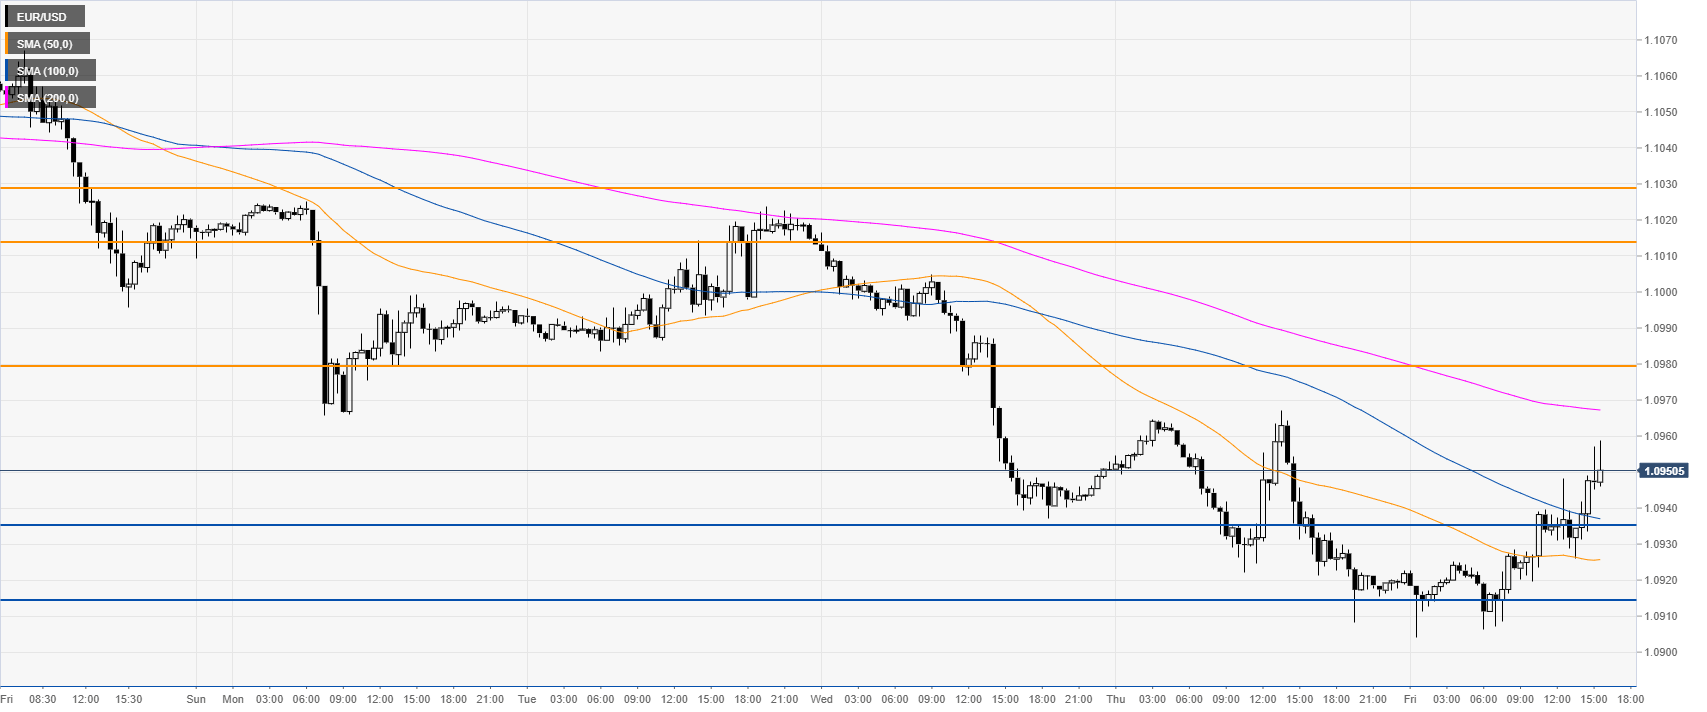
EUR/USD 30-minute chart
EUR/USD is trading between the 100 and 200 SMAs, suggesting a correction up in the near term. The market is likely en route towards 1.0980 resistance. If broken, the 1.1014 level can come into play, according to the Technical Confluences Indicator.
Additional key levels
