- The level to beat for bears is the 1.2200 handle.
- Irish backstop news sent GBP higher across the board.
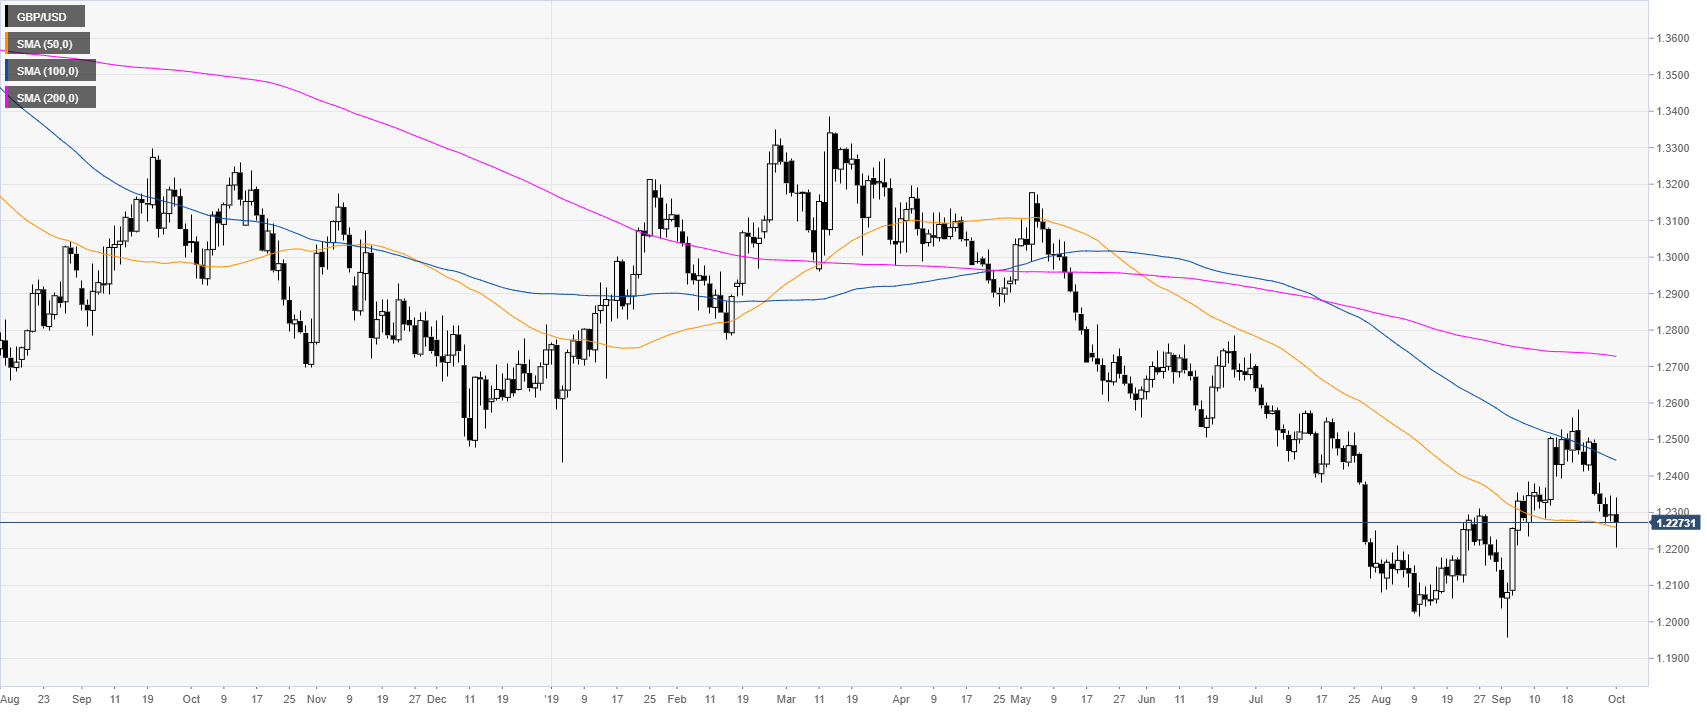
GBP/USD daily chart
The Sterling is trading in a downtrend below its main daily simple moving averages (DSMAs). In the New York session, the ISM Manufacturing PMI came in at 10-year lows at 47.8 vs. 50.1 forecast, weakening USD while the Irish backstop news sent GBP higher across the board.
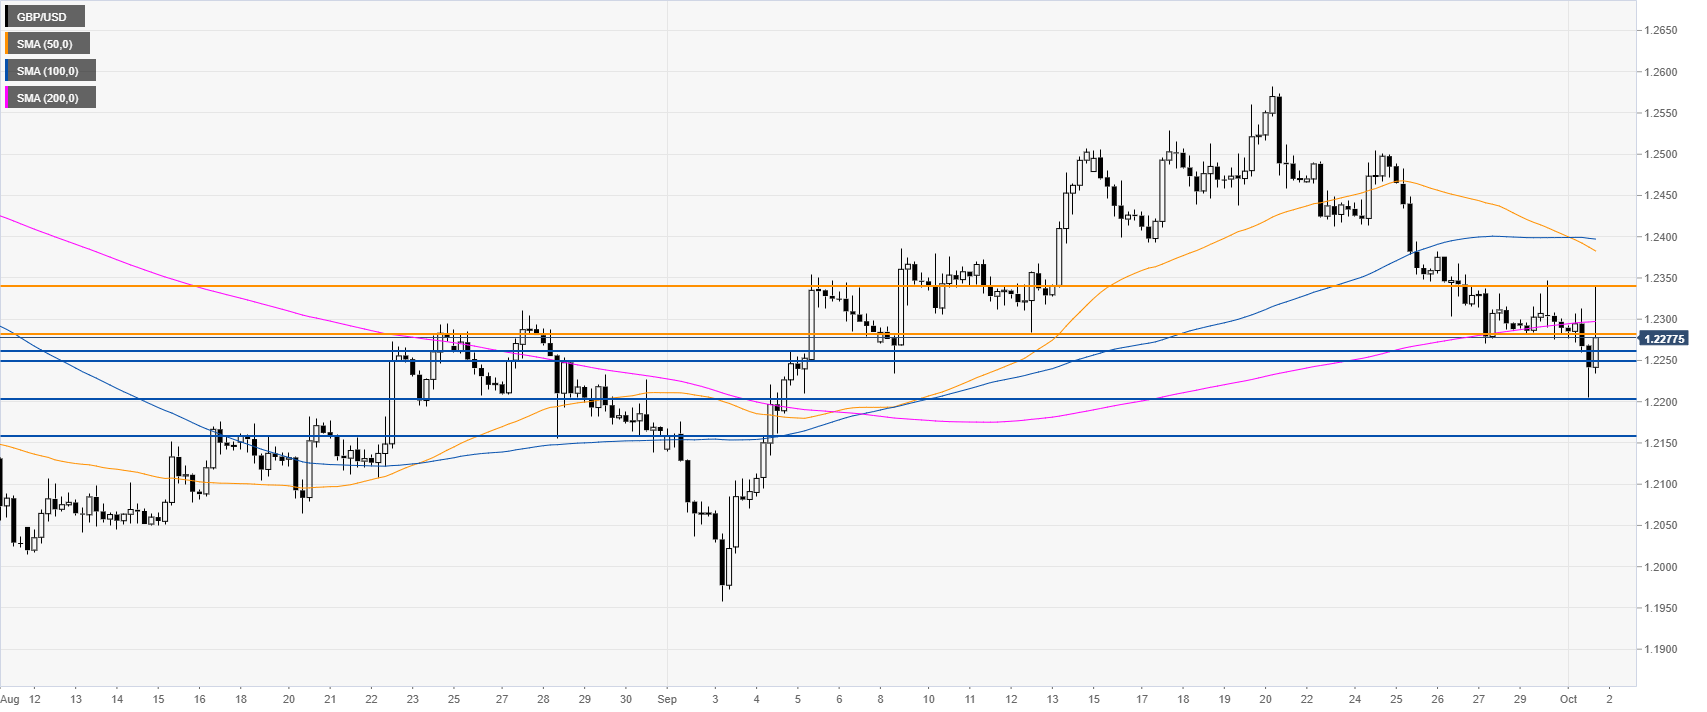
GBP/USD four-hour chart
GBP/USD is trading below the main SMAs, suggesting a bearish bias in the medium term. A break below the 1.2200 level would expose the 1.2157 support on the way down, according to the Technical Confluences Indicator.
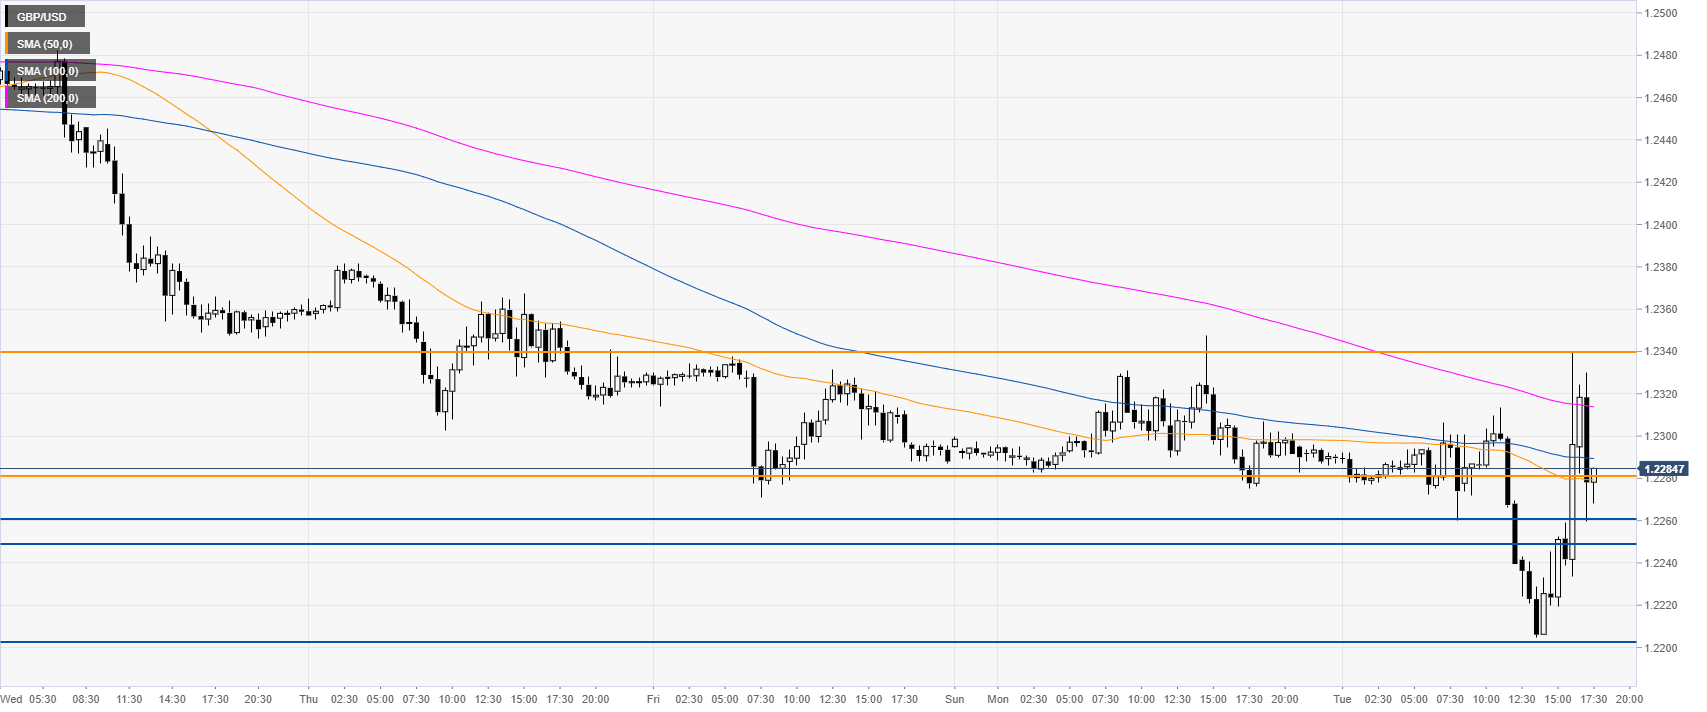
GBP/USD 30-minute
The Pound/US Dollar exchange is trading below the main SMAs on the 30-minute chart, suggesting a bearish bias in the short term. Immediate resistances are seen at the 1.2280 and 1.2340 levels, according to the Technical Confluences Indicator.
Additional key levels
