- GBP/AUD fails to sustain a break of 61.8% Fibonacci retracement.
- 50/100/200-day EMAs jointly provide strong downside support.
- A short-term rising triangle portrays the overall strength of upside momentum.
While failure to sustain a break of 61.8% Fibonacci retracement of May-July downpour drags the GBP/AUD pair, a confluence of key exponential moving averages (EMAs) offers strong downside support as the quote seesaws near 1.8290 by the press time ahead of Europe open on Wednesday.
Though, 50% Fibonacci retracement level near 1.8220 can act as immediate support ahead of highlighting the join of 50, 100 and 200-day EMAs around 1.8110/20.
It should also be noted that pair’s declines below 1.8110 will be tested by a rising trend-line since late-July, part of the ascending triangle formation, at 1.7985.
Meanwhile, the pair’s successful rise above 61.8% Fibonacci retracement around 1.8380 enables buyers to challenge the triangle resistance, at 1.8500.
Furthermore, bulls can take a halt around 1.8530 while holding the reins above 1.8500, a break of which could challenge May 25 high of 1.8620.
GBP/AUD daily chart
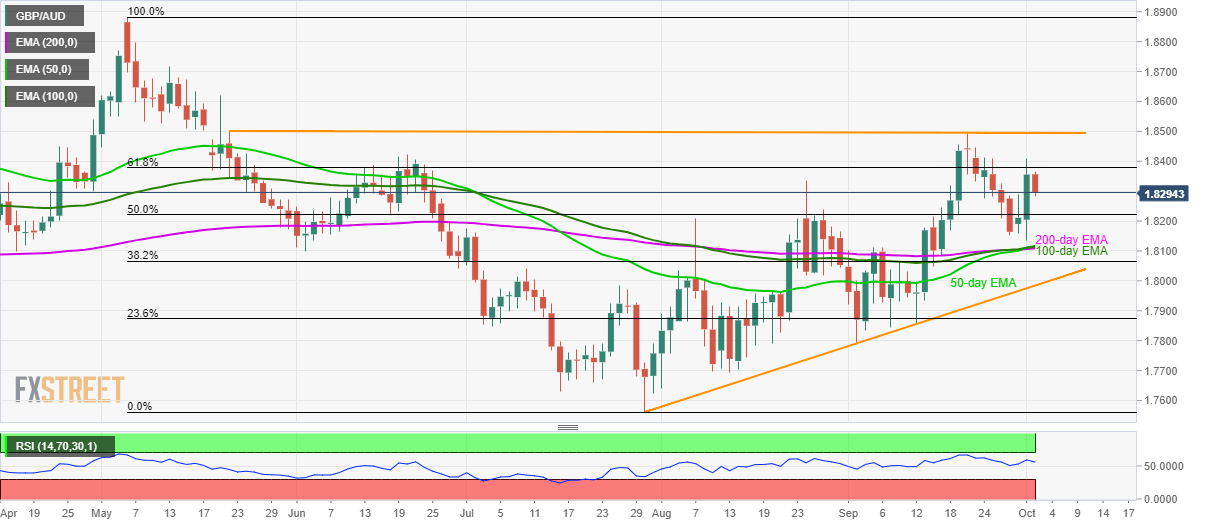
Trend: Bullish
