- USD/CAD extends south-run following heavy declines.
- A negative candle after the Doji, coupled with bearish MACD, favor sellers.
- Two-week-old resistance-line caps upside beyond the key EMA.
Following losses on the daily candle after a bearish Doji, the USD/CAD pair declines to intra-day low of 1.3218 during early Wednesday.
In addition to downward signaling candlestick formation, a sustained trading below the 200-day exponential moving average (EMA) and bearish signals from the 12-bar moving average convergence and divergence (MACD) also indicate pair’s further south-run.
In doing so, 50% Fibonacci retracement of July-September upside, at 1.3200, could be the first to lure bears before pushing them towards an upward sloping trend-line since July 19, at 1.3182 now.
Should there be additional weakness past-1.3182, prices can revisit September month low nearing 1.3130.
On the upside, 38.2% Fibonacci retracement and 200-day EMA together limit the pair’s immediate advances around 1.3243/47, a break of which could trigger rise towards a fortnight-long falling trend-line, at 1.3290.
Additionally, pair’s sustained advances beyond 1.3290 enable it to challenge the previous month high nearing 1.3310.
USD/CAD daily chart
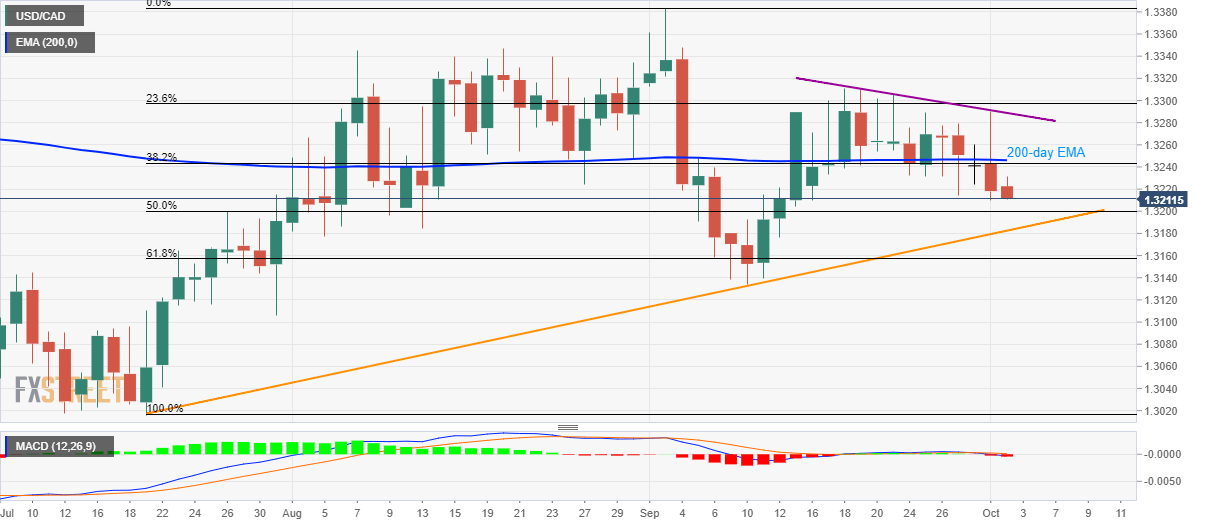
Trend: bearish
