USD/JPY has been moving higher amid reports that the US and China may agree on a currency pact and delay new tariffs. Can it continue higher? Technicals look promising.
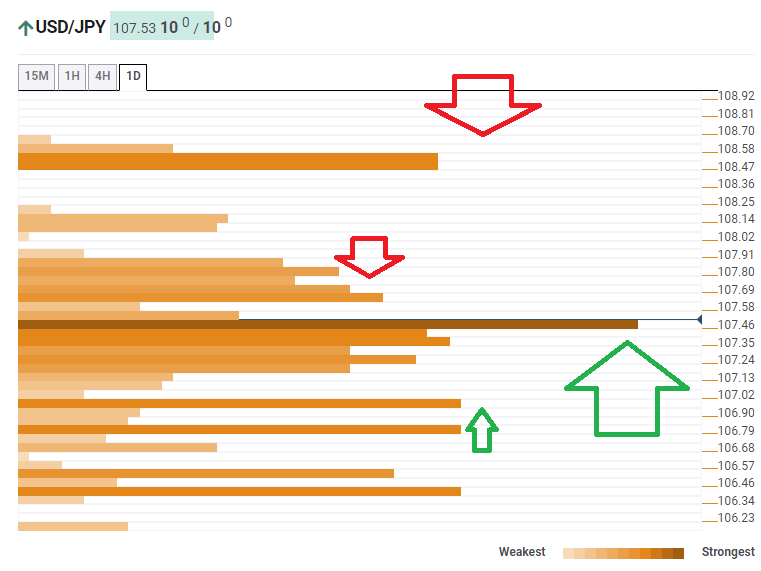
The Technical Confluences Indicator is showing that USD/JPY enjoys robust support at 107.46, which is a dense cluster of lines including the Bollinger Band one-hour Middle, the Fibonacci 38.2% one-month, the Simple Moving Average 10-one-day, the SMA 200-1h, the Fibonacci 38.2% one-day, the SMA 10-1h, and the SMA 5-4h.
Looking up, weak resistance awaits at 107.63, which is the convergence of the BB 4h-Upper, the SMA 100-one-day, the previous daily high,
Higher, the upside target is 108.47, which is where the Pivot Point one-day Resistance 3 and the previous monthly high converge.
Below 107.46, the next support line is at 106.95, which is is the confluence of the previous daily low and the Fibonacci 23.6% one-week.
Here is how it looks on the tool:
Confluence Detector
The Confluence Detector finds exciting opportunities using Technical Confluences. The TC is a tool to locate and point out those price levels where there is a congestion of indicators, moving averages, Fibonacci levels, Pivot Points, etc. Knowing where these congestion points are located is very useful for the trader, and can be used as a basis for different strategies.
This tool assigns a certain amount of “weight” to each indicator, and this “weight” can influence adjacents price levels. These weightings mean that one price level without any indicator or moving average but under the influence of two “strongly weighted” levels accumulate more resistance than their neighbors. In these cases, the tool signals resistance in apparently empty areas.
Learn more about Technical Confluence
