- GBP/USD is extending the bull run flirting with the 1.2800 handle.
- GBP/USD leaps to 1.2750 on reports of a draft Brexit deal.
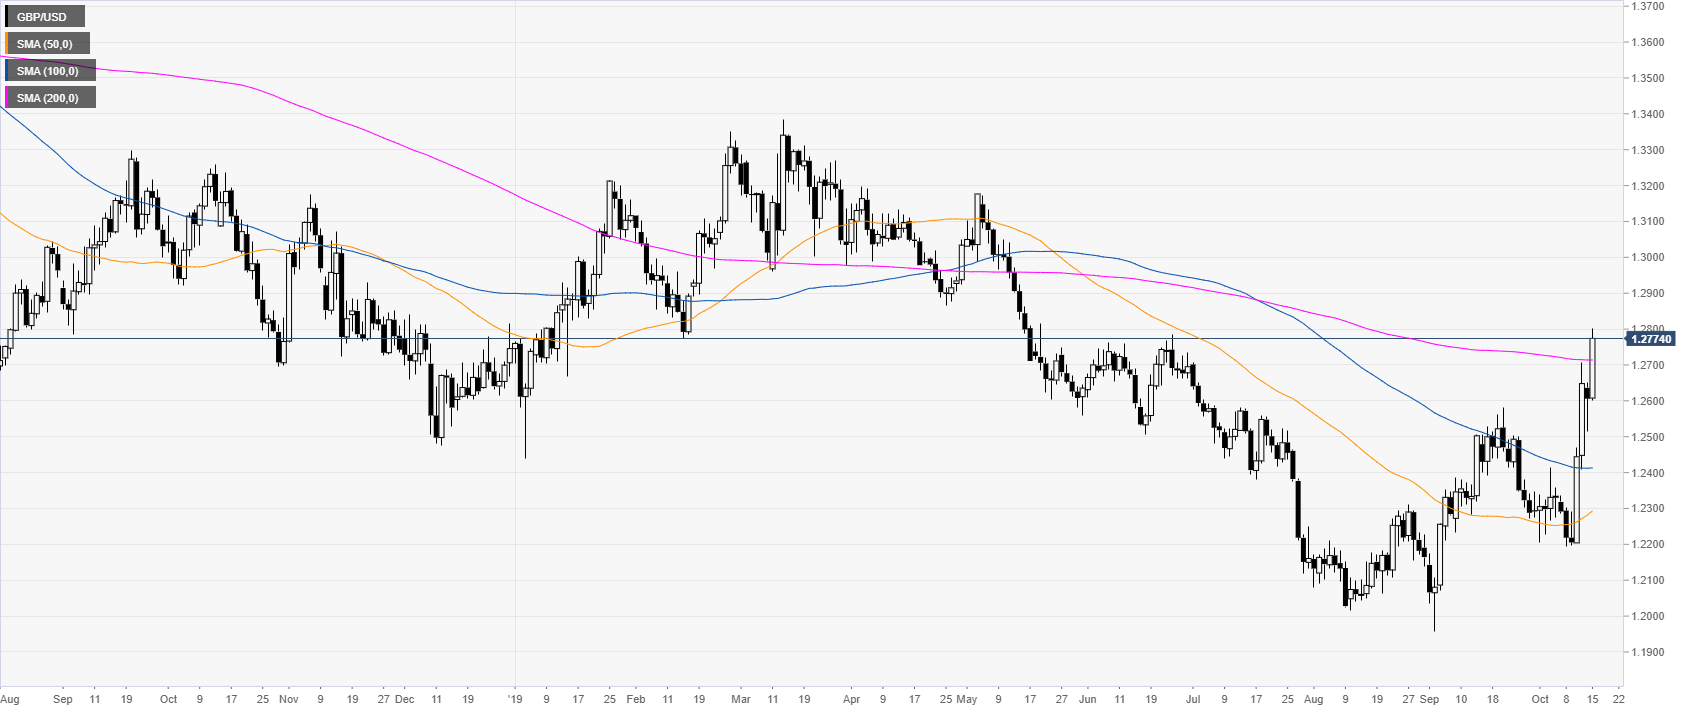
GBP/USD daily chart
GBP/USD, on the daily chart, is attempting a bullish reversal above the 200-day simple moving average (DSMA). This Tuesday, GBP/USD leaps to 1.2750 on reports of a draft Brexit deal.
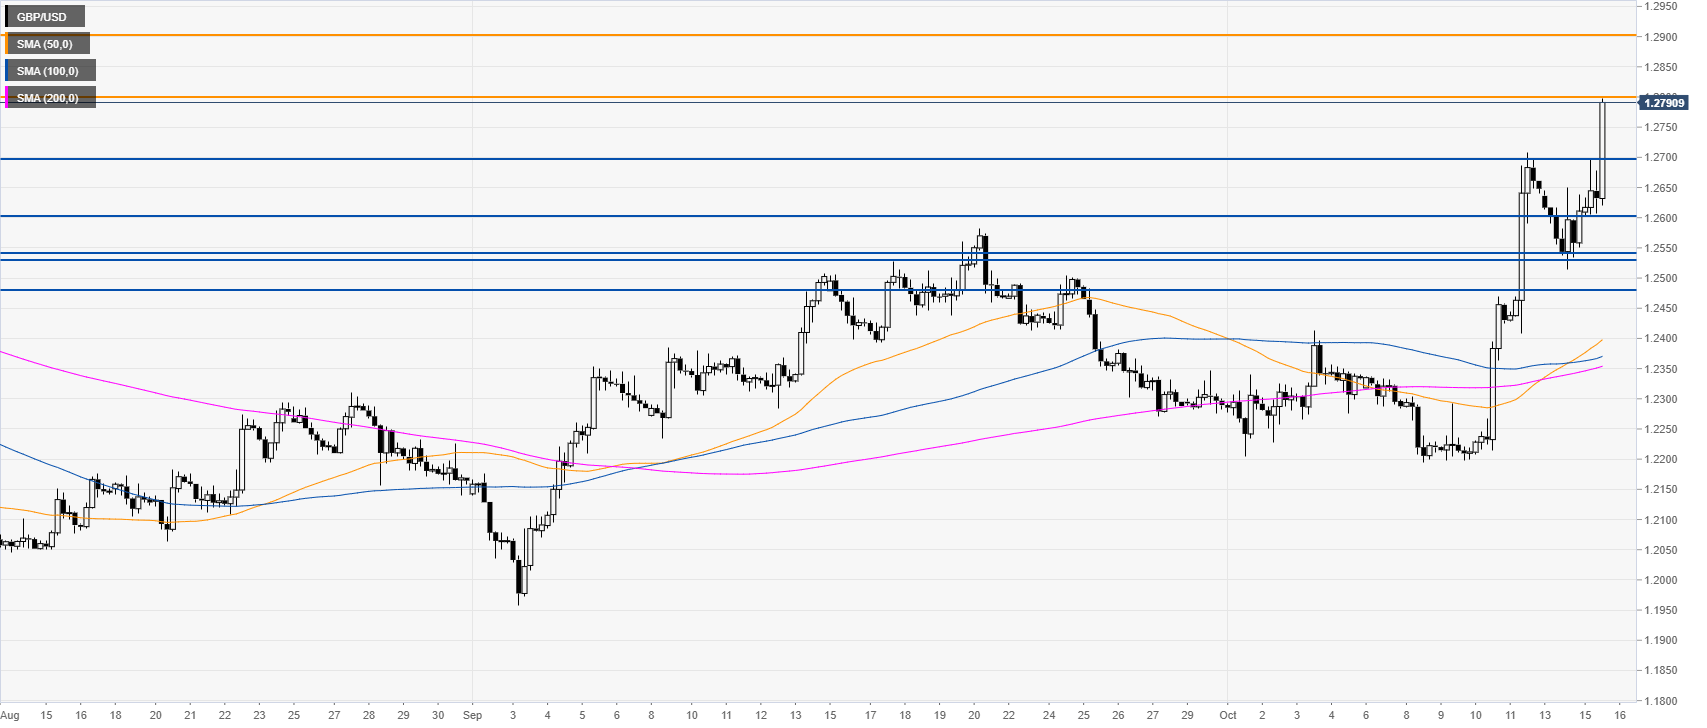
GBP/USD four-hour chart
GBP/USD is extending the null move to the 1.2800 handle while trading above its main SMAs. If bulls overcome the 1.2700 figure the next target can be located at the 1.2800 round number.
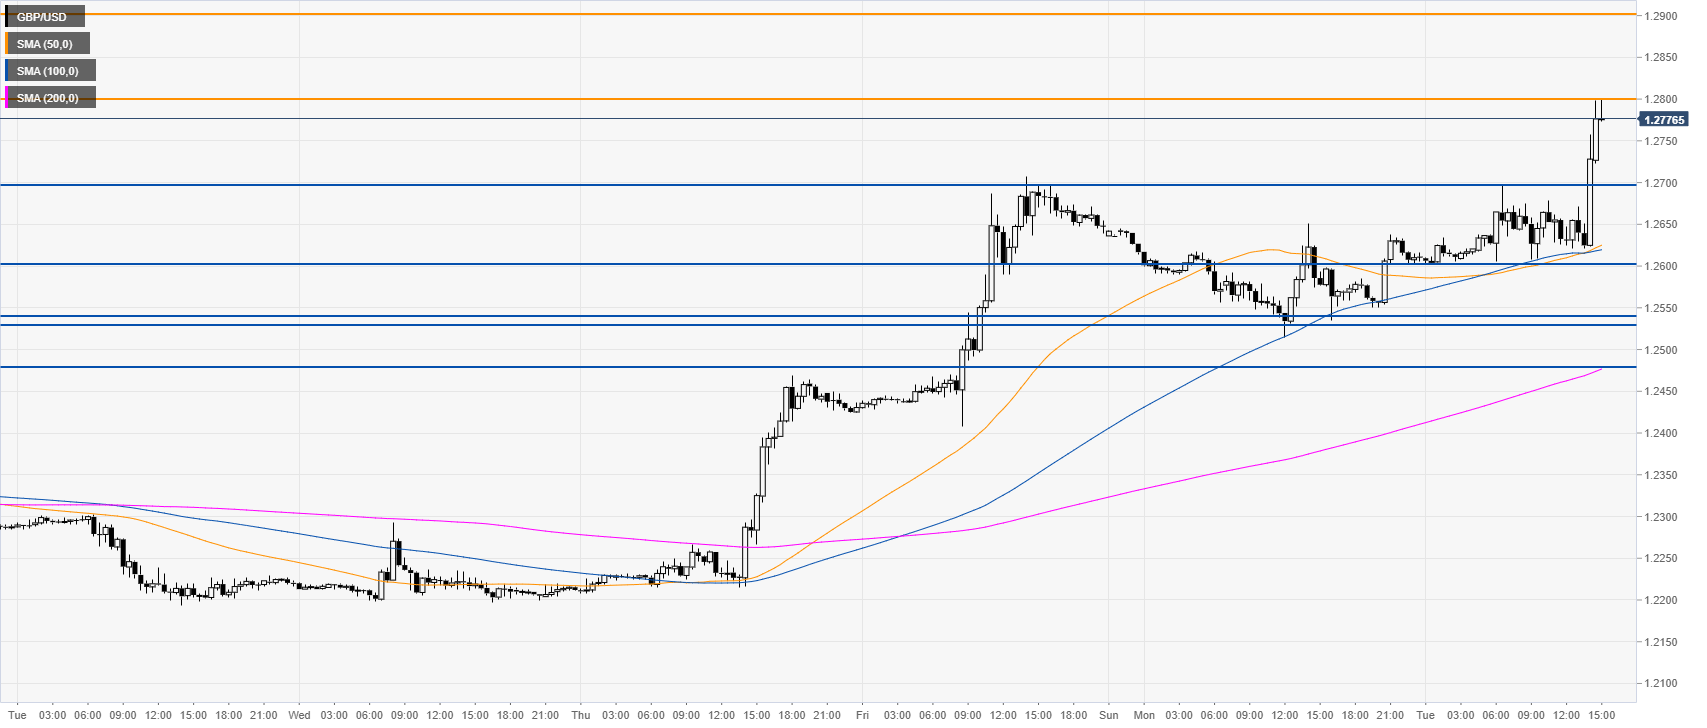
GBP/USD 30-minute chart
The Sterling is trading above the main SMAs, suggesting bullish momentum in the near term. Support is seen at the 1.2700 figure and the 1.2543/30 support zone, according to the Technical Confluences Indicator.
Additional key levels


