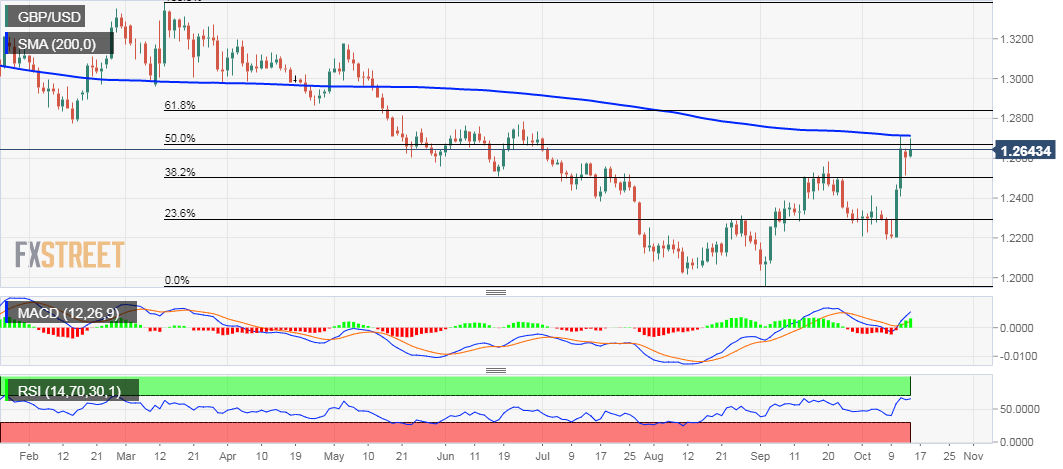
- The pair continued with its struggle to find acceptance above 50% Fibo. level.
- Technical set-up warrants some caution before placing any aggressive bets.
The GBP/USD pair continued with its struggle to make it through the very important 200-day SMA and trimmed a part of the early positive move, back closer to over three-month tops set on Friday.
The overnight bounce from a previous resistance breakpoint turned support near 38.2% Fibonacci level of the 1.3381-1.1959 downfall and a subsequent move up support prospects for additional gains.
However, the pair’s inability to sustain above 50% Fibonacci level of the 1.3381-1.1959 downfall and repeated rejection near the mentioned barrier might be seen as initial signs of bullish exhaustion.
Meanwhile, technical indicators on the daily chart maintained their bullish bias but are flashing slightly overbought conditions on the 4-hourly chart, further warranting some caution for bullish traders.
Hence, it will be prudent to wait for a sustained move beyond the 1.2700 handle before traders start positioning for any further near-term appreciating move towards reclaiming the 1.2800 round-figure mark.
On the flip side, sustained weakness back below the 1.2600 mark might prompt some technical selling and drag the pair back towards challenging the overnight swing lows, around the 1.2515-10 region.
GBP/USD Daily chart

