- GBP/USD struggles to extend upside amid overbought RSI conditions.
- 1.2765/60, 200-day SMA acts as nearby supports.
Not only 61.8% Fibonacci retracement of March-September declines but April low also challenges GBP/USD buyers as the quote seesaws near 1.2825 during early Asian session on Thursday.
Prices stay firm around the five-month high but overbought conditions of 14-bar Relative Strength Index (RSI) and inability to cross the key resistances seem to doubt the latest run-up.
As a result, sellers will look for the pair’s downside break of 1.2765/60 horizontal area, including multiple highs marked since mid-May, in order to aim for 200-day Simple Moving Average (SMA) level of 1.2715.
During the pair’s further weakness past-1.2715, 50% Fibonacci retracement level of 1.2670 and September month high surrounding 1.2580 could lure bears.
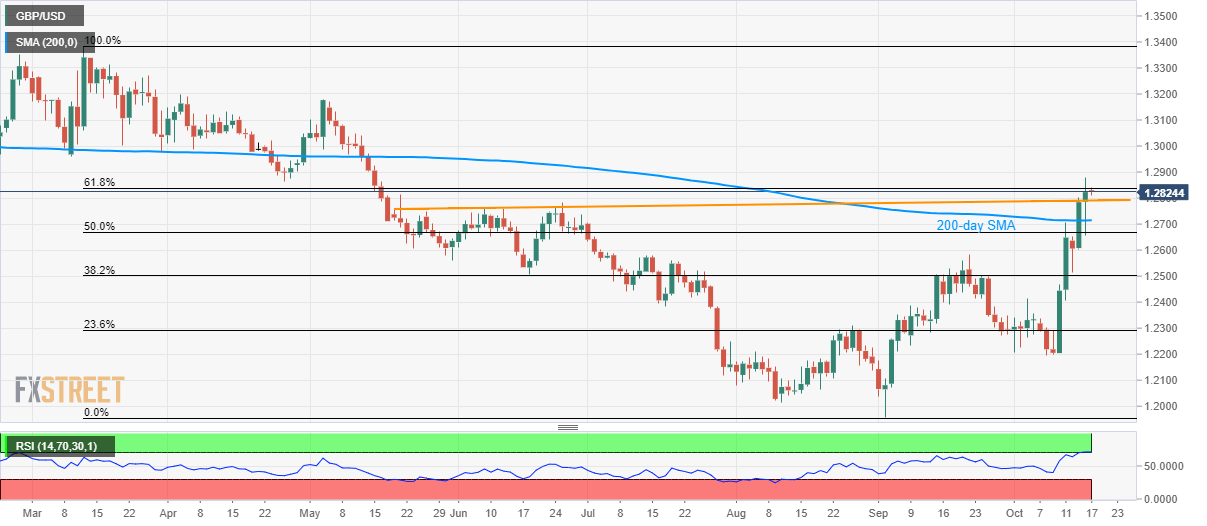
On the flip side, a sustained break of 61.8% Fibonacci retracement, at 1.2840, followed by a rise beyond April low of 1.2865, can propel the bulls towards 1.2900 and 1.2980/85 resistance levels.
GBP/USD daily chart
Trend: pullback expected
