- GBP/USD is trading at daily lows in the New York session.
- The level to beat for sellers is the 1.2815 support.
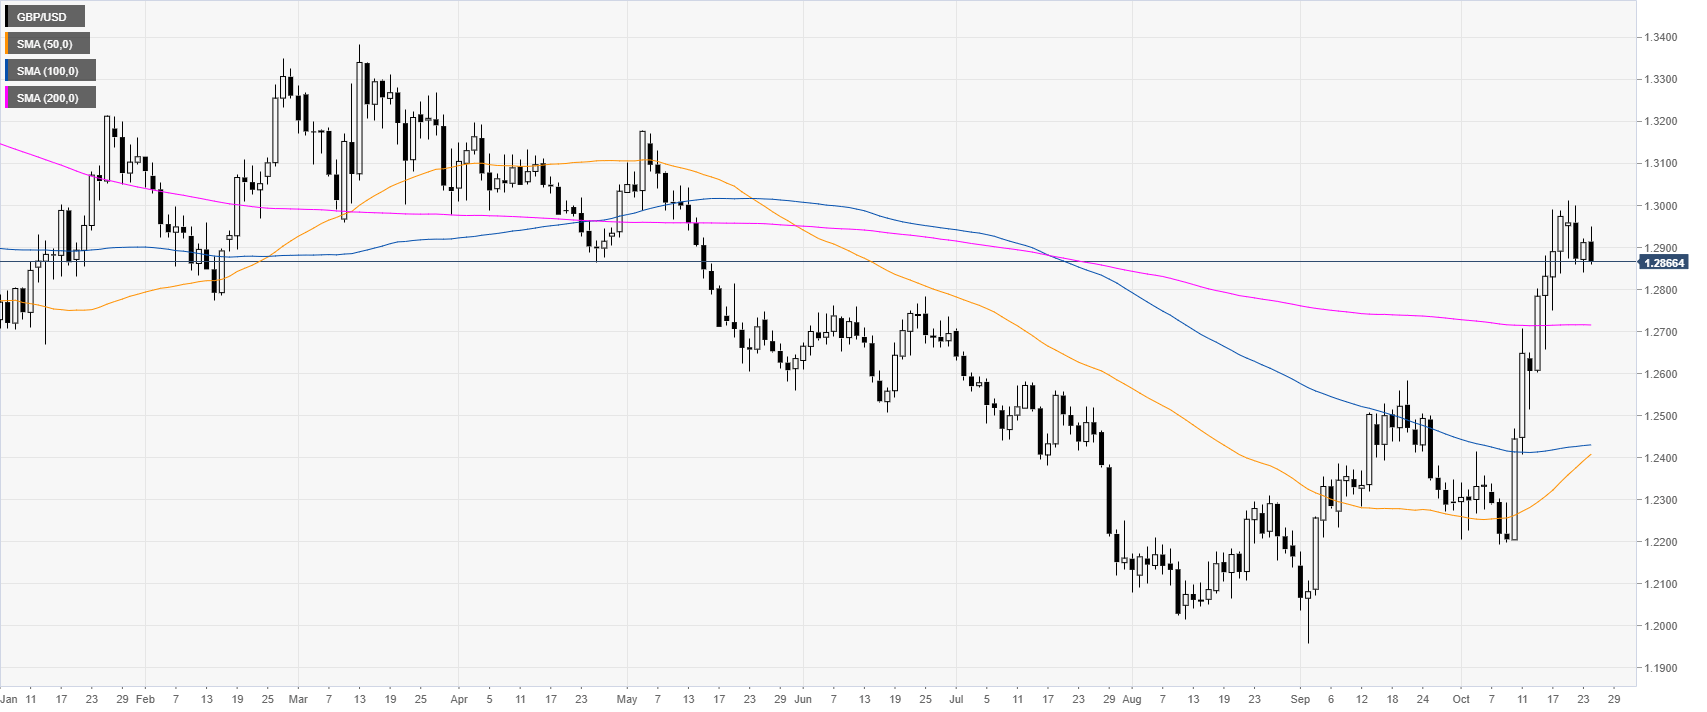
GBP/USD daily chart
The Sterling, on the daily chart, had a spike above its main daily simple moving averages (DSMAs) while reaching levels not seen since mid-May 2019. The Brexit headlines remain the main drivers behind the GBP/USD moves.
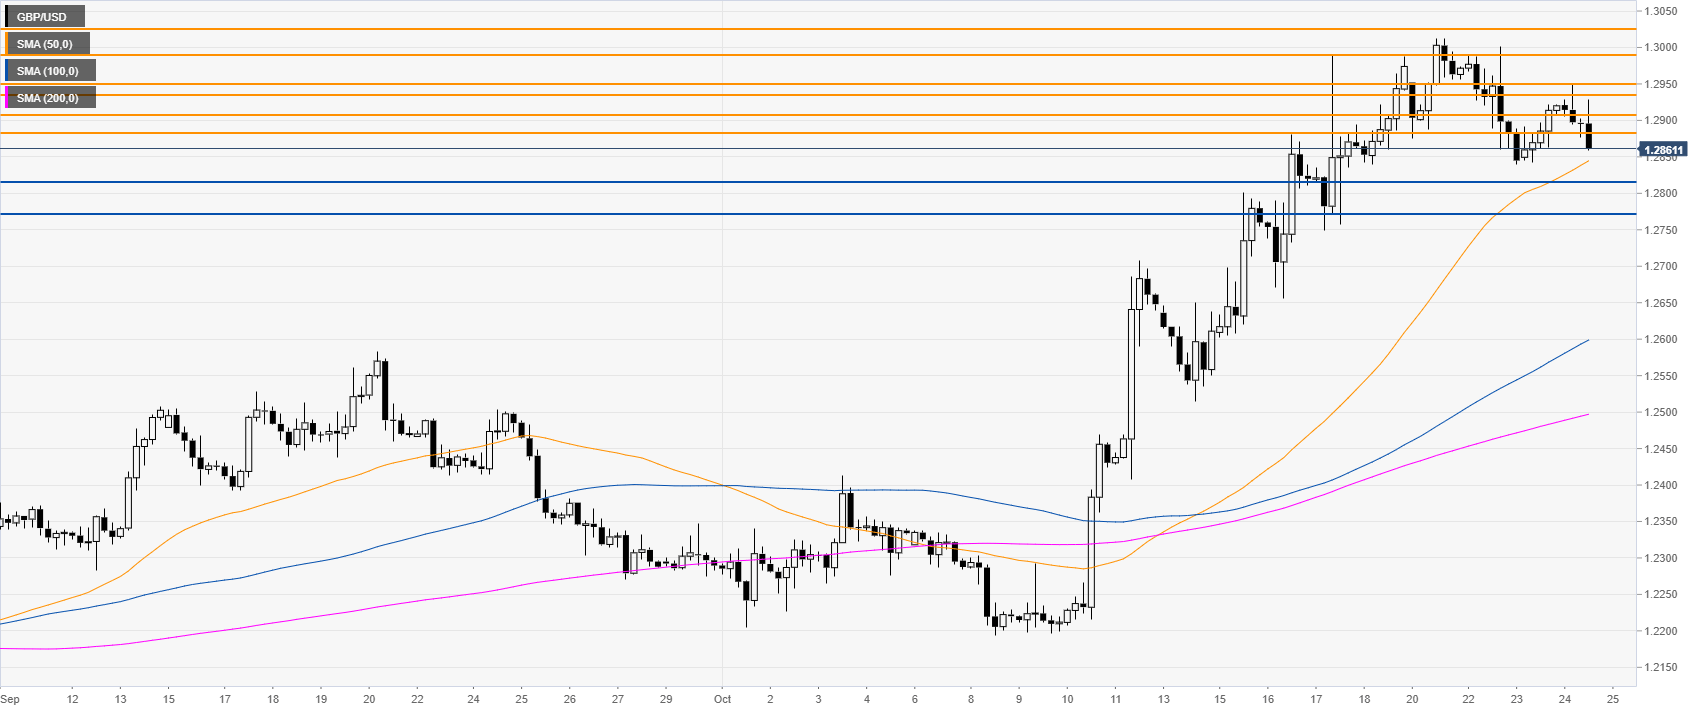
GBP/USD four-hour chart
The Sterling is trading in a bull channel above its main SMAs. However, GBP/USD is retracing down, below the 1.2900 handle while approaching the 50 SMA. Sellers need to break the 1.2815 support to travel towards the 1.2772 price level, according to the Technical Confluences Indicator.
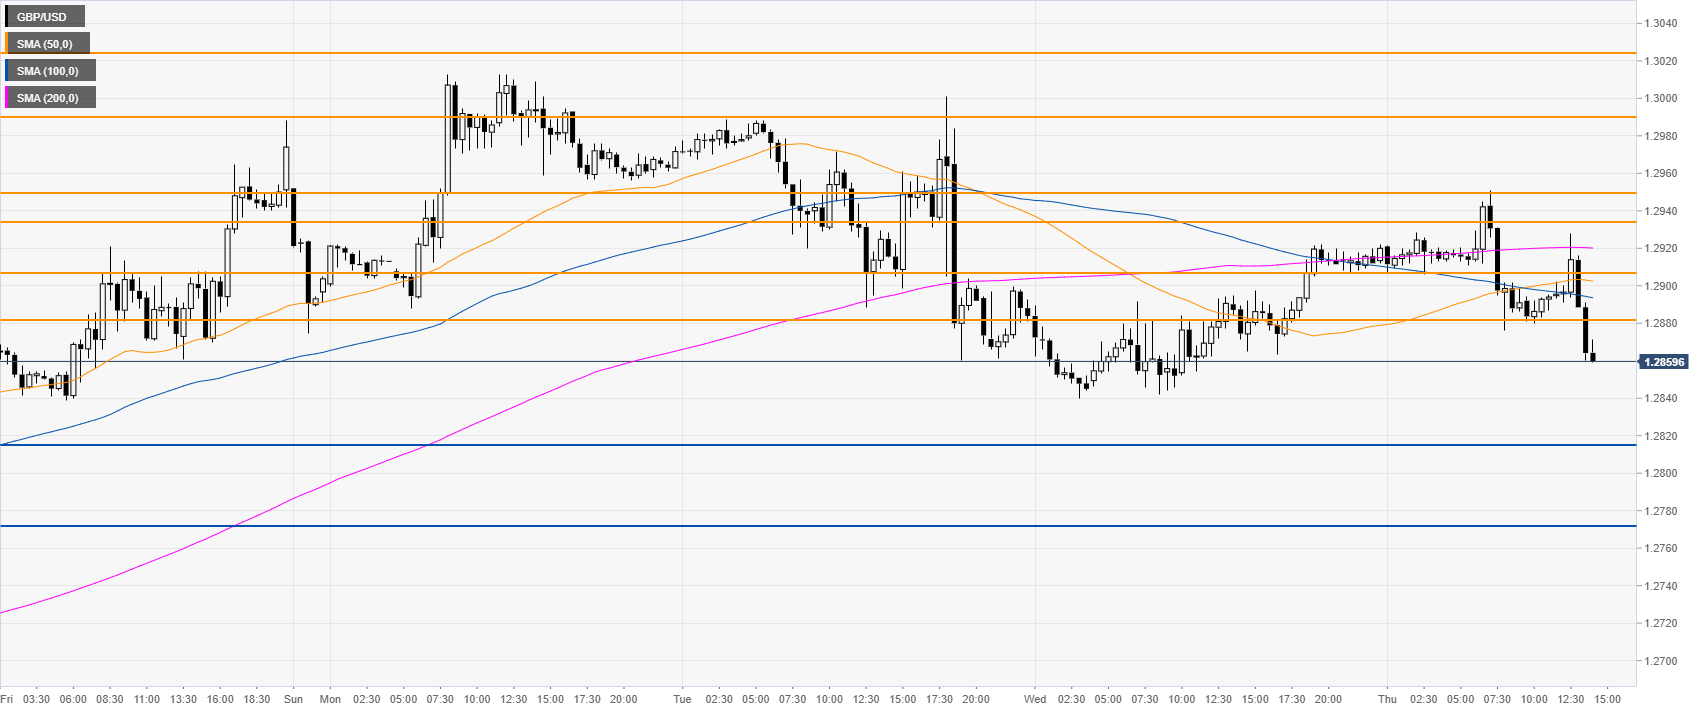
GBP/USD 30-minute chart
GBP/USD is trading below the main SMAs, suggesting a bearish momentum in the near term. Resistance is seen at 1.2880 and 1.2908, according to the Technical Confluences Indicator.
Additional key levels
