- EUR/GBP is hovering near the October lows.
- The level to beat for bears is the 0.8625 support.
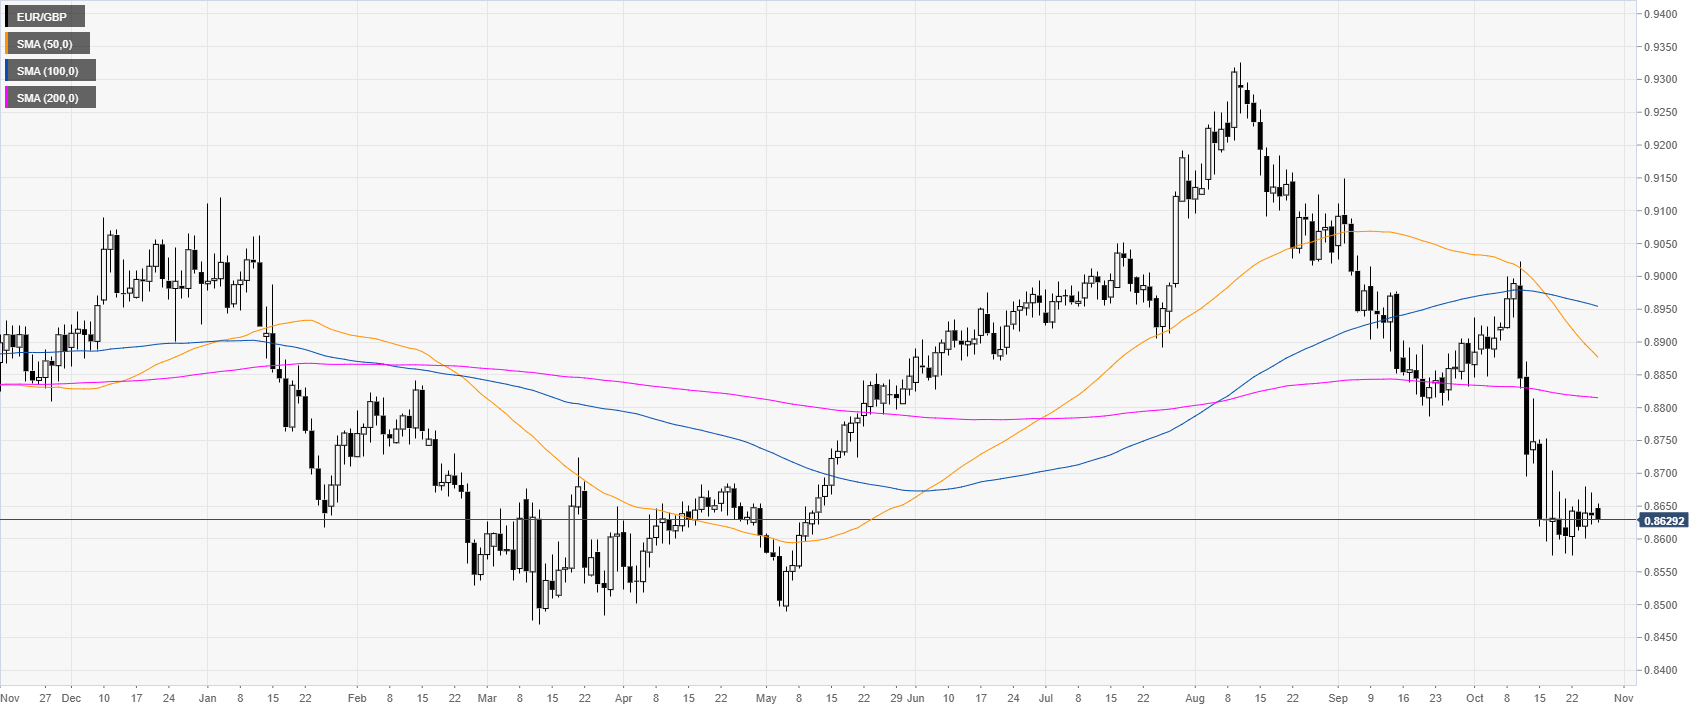
EUR/GBP daily chart
On the daily chart, EUR/GBP is trading in a bear trend below the main daily simple moving averages (DMAs). In the last weeks of trading, the optimism of a Brexit deal dragged the spot below the 0.8600 handle.
EUR/GBP four-hour chart
EUR/GBP is trading below its main SMAs, suggesting a bearish bias in the medium term. In the medium term, a daily close below the 0.8575 support can potentially lead the market to the 0.8500 handle, according to the Technical Confluences Indicator.

EUR/GBP 30-minute chart
EUR/GBP is trading below its main SMAs, suggesting a bearish bias in the near term. Bears are challenging the daily lows and the 0.8625 support level. A break below it can lead to further losses towards the 0.8600 handle and 0.8570. Resistance is seen at the 0.8650/80 price levels.

Additional key levels
