- USD/IDR pulls back from 21-day EMA.
- Gradually declining, but away from oversold conditions, RSI favors further weakness towards the key supports.
With its failure to rise past-21-day EMA, USD/IDR declines to 14,020 by the press time ahead of the European session on Monday.
The quote now seems to revisit 23.6% Fibonacci retracement of December 2018 to June 2019 declines, at 13,975, a break of which will shift market attention to an upward sloping trend line since June, at 13,950.
Should prices keep trading southwards below 13,950, September month low near 13,880 will be the key to watch.
Also supporting the downside is gradually declining, but not oversold, conditions of 14-bar Relative Strength Index.
Alternatively, pair’s successful rise above 21-day Exponential Moving Average (EMA) level of 14,100 can push buyers to target 50% Fibonacci retracement level close to 14,230 whereas monthly top surrounding 14,275 could entertain bulls afterward.
USD/IDR daily chart
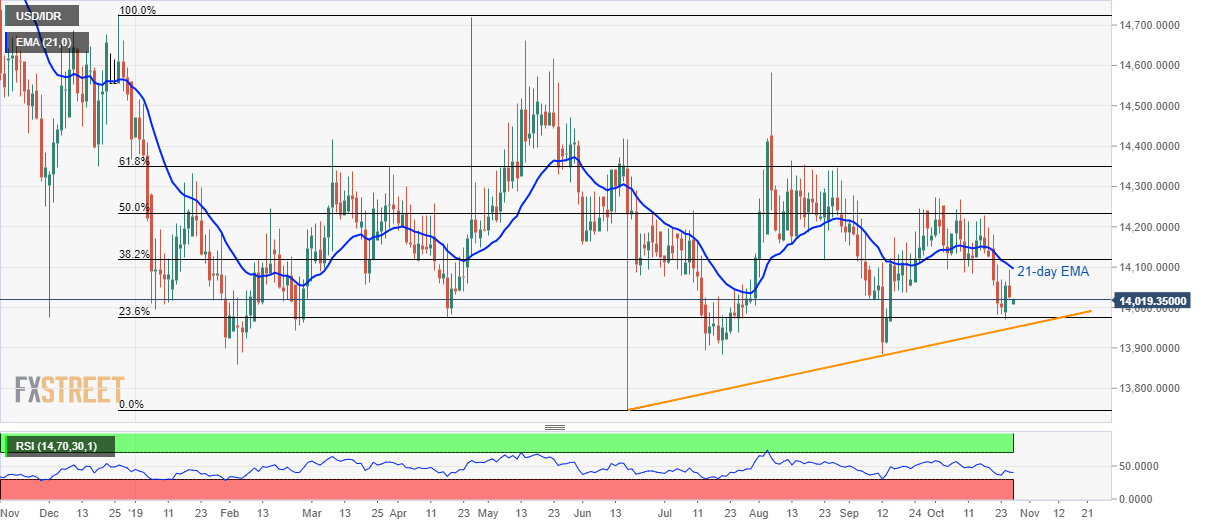
Trend: bearish
