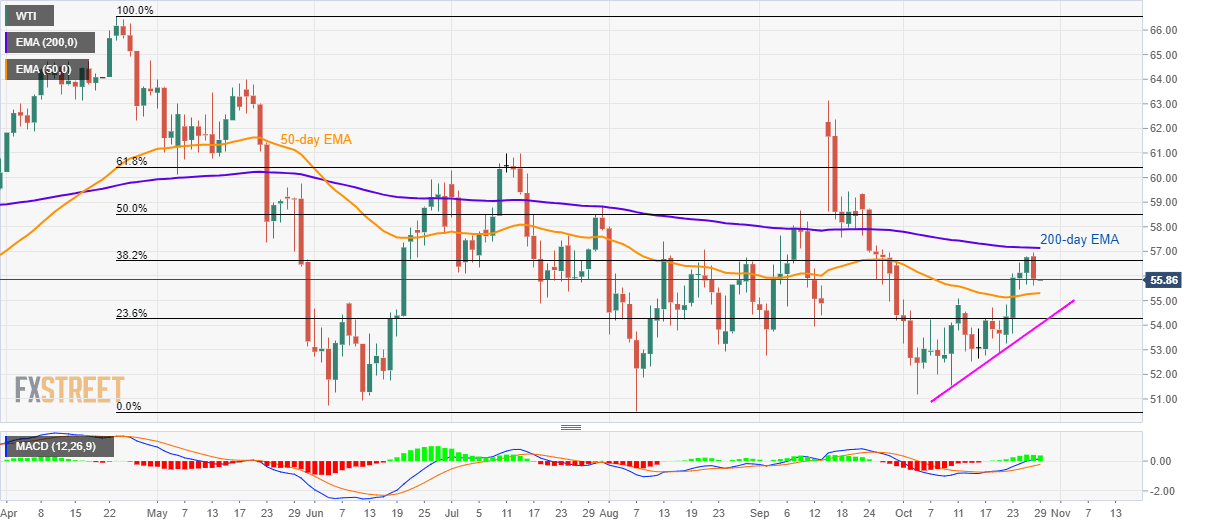
- WTI pulls back from 200-day EMA, forms bearish candlestick formation on the daily chart.
- A downside break below $55 will shift bears’ attention to the multi-day-old rising support line.
Having reversed from 200-day EMA, WTI seesaws around $55.85 during Tuesday’s initial hours of the Asian session.
Looking at the price pattern on the Daily (D1) chart, the quote formed a “Bearish Engulfing” candlestick formation on Monday, which in turn favors the energy benchmark’s further declines.
In doing so, a 50-day Exponential Moving Average (EMA) level of $55.30, followed by an area including month-start top and October 11 high near $55.00, gains short-term seller’s attention.
Should there be a further decline in prices below $55.00, an upward sloping trend line since October 10, at $54.00, will be the key for bears as it holds the gate for mid-month lows surrounding $52.50.
On the contrary, a daily closing beyond a 200-day EMA level of $57.15 will defy the bearish pattern and could trigger fresh run-up towards 50% Fibonacci retracement of April-August declines, close to $58.50.
WTI daily chart
Trend: pullback expected
