- USD/INR tests 100-day EMA multiple times on the daily chart, carries the support line breakdown on the weekly format.
- An eight-week-old falling trend line adds to the resistance.
Although 100-day EMA has been holding the pair’s declines ever since it crossed the same during early August, USD/INR stays below a weekly support line break while taking rounds to 70.76 ahead of the European session on Thursday.
With this, pair’s declines below 100-day Exponential Moving Average (EMA) level of 70.70 on the daily chart (D1) could extend the pair’s declines to 38.2% Fibonacci retracement of the year 2018 run-up, at 70.45, on the weekly chart (W1) and multiple lows around 70.35.
It should, however, be noted that 70.00 round-figure and 11-month rising support line, at 69.30, will challenge sellers past-70.35.
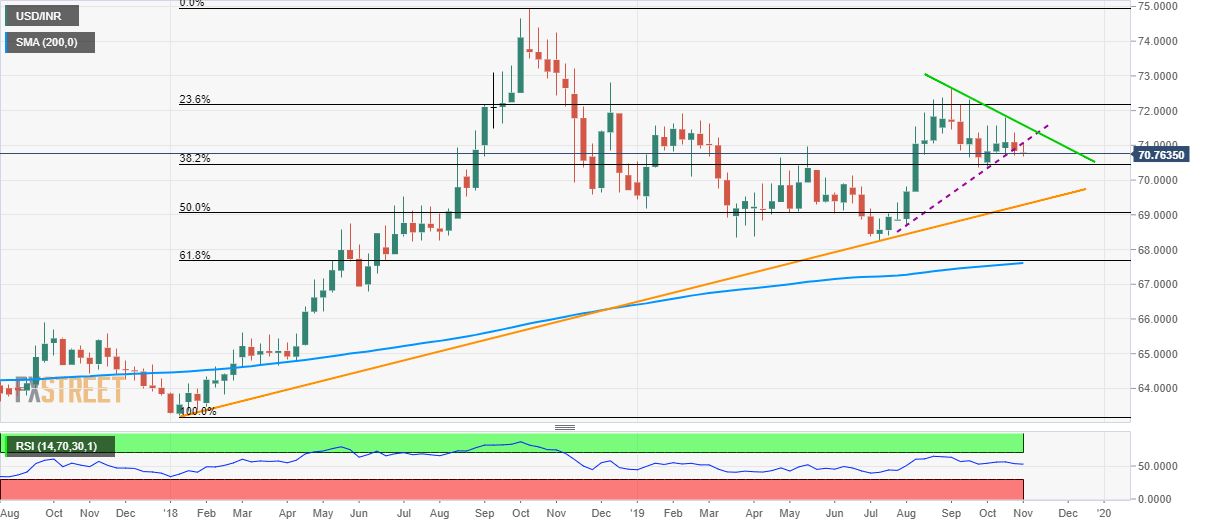
On the contrary, pair’s recovery beyond support-turned-resistance, at 71.05 now, could trigger a fresh upside to a falling resistance since early-September, at 71.60.
In a case where prices rally past-71.60, 23.6% Fibonacci retracement on W1, at 72.13, will please the bulls.
USD/INR weekly chart
Trend: bearish
