- The Fiber is trading at two-day lows challenging the 100 DMA.
- The newly appointed ECB’s President, Christine Lagarde, delivered her speech but no comments about monetary policy were made.
- The level to beat for bears is the 1.1126 support level.
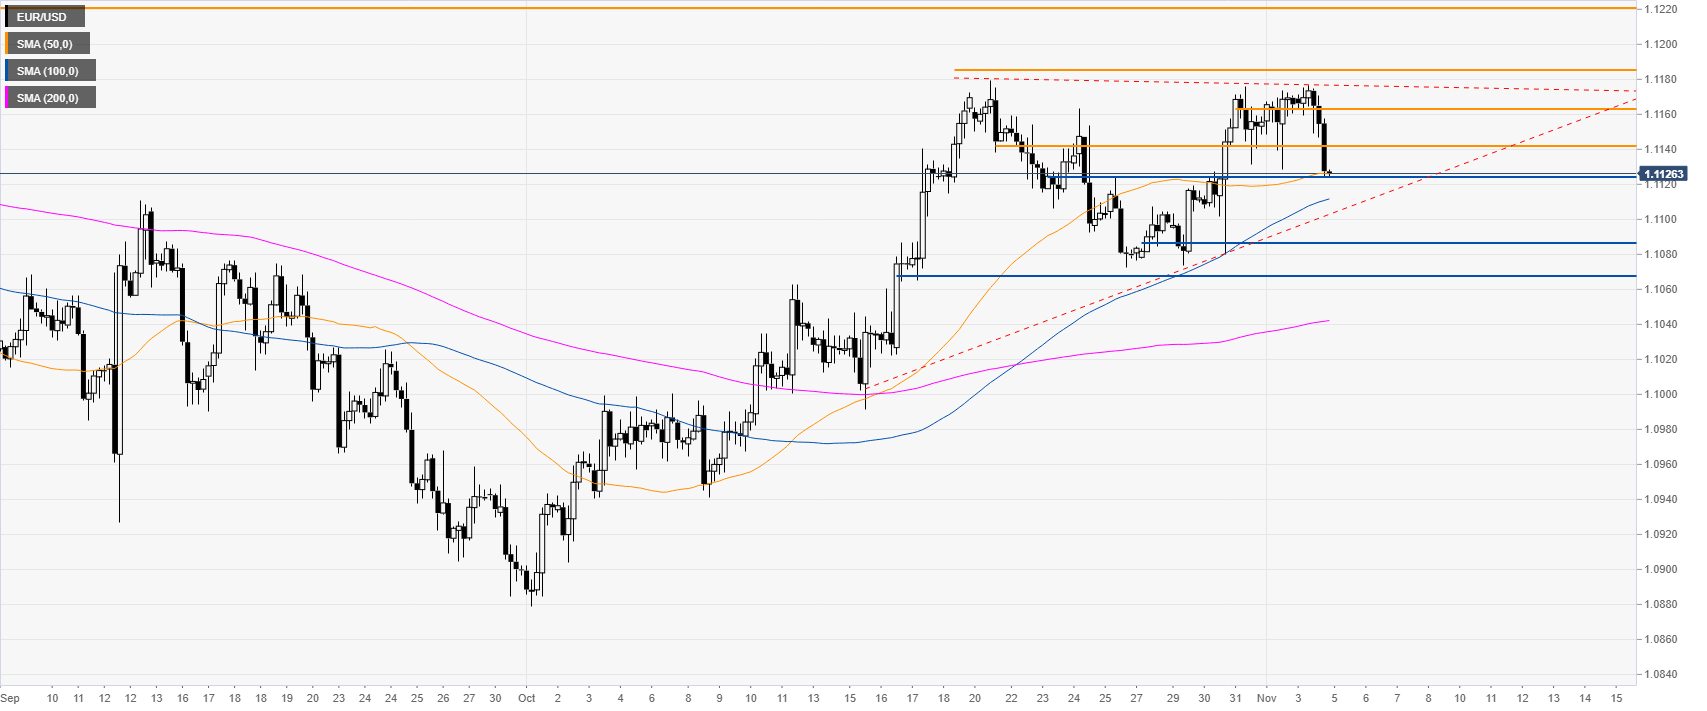
EUR/USD daily chart
On the daily chart, the Euro is trading in a downtrend below its 200-day simple moving average (DMA) while challenging the 100 DMA. This Monday, the newly appointed ECB’s President, Christine Lagarde, delivered a speech. However, she made no comments about monetary policy and the event had no significant effect on the currency pair.

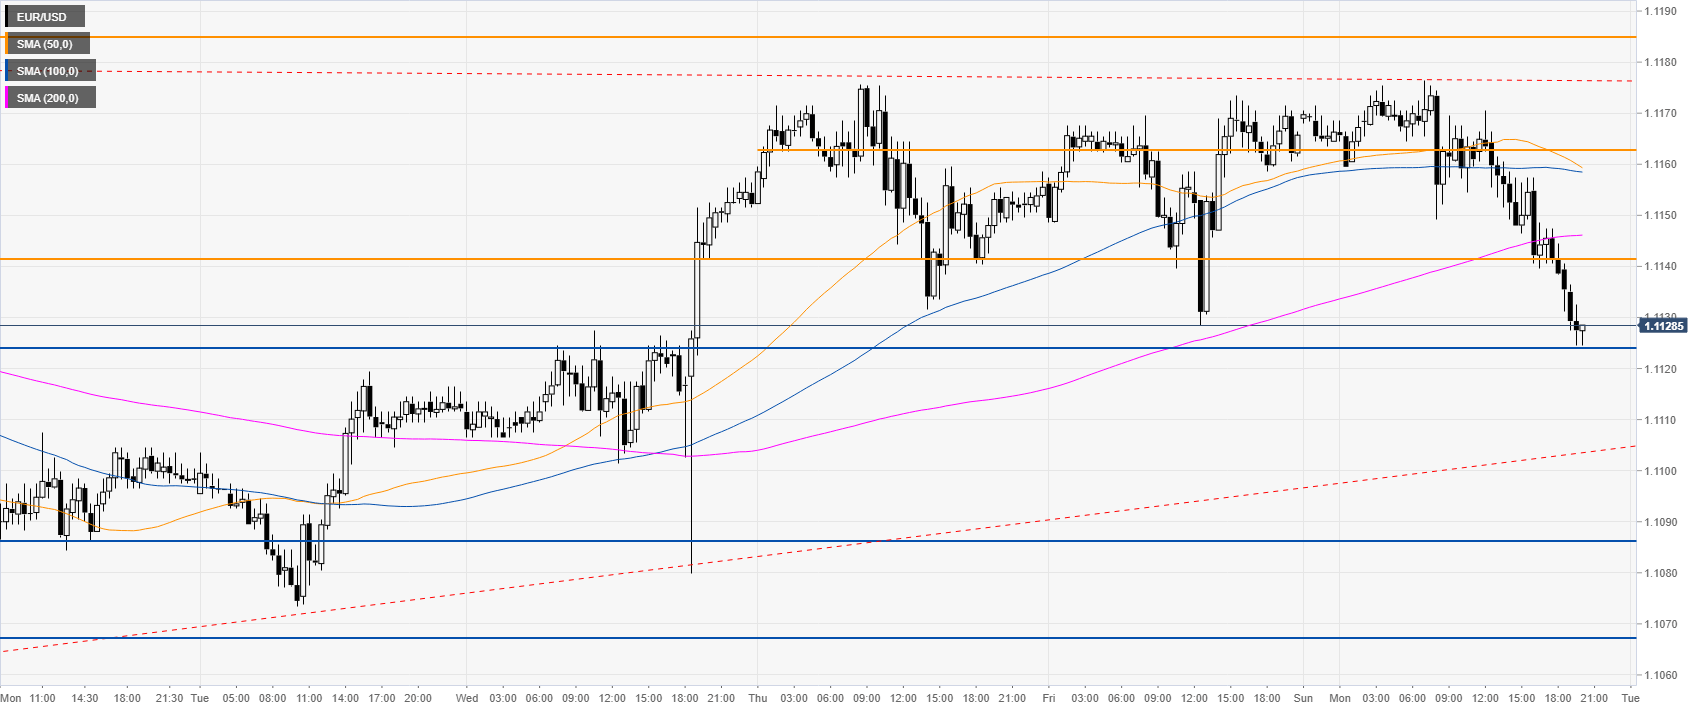
EUR/USD four-hour chart
The Euro, on the four-hour chart, is likely trading in an ascending triangle pattern while above its main SMAs. The spot is about to register its worst daily decline since September 30 as EUR/USD is easing from a double top with the October highs. The market is challenging the 1.1126 support and the 50 SMA. A break below this level can lead to further weakness towards the 1.1086/1.1069 support zone, according to the Technical Confluences Indicator.
EUR/USD 30-minute chart
EUR/USD is trading below its main SMAs, suggesting a bearish bias in the near term. Resistance is seen at the 1.1141 level followed by the 1.1162 level, according to the Technical Confluences Indicator.
Additional key levels
