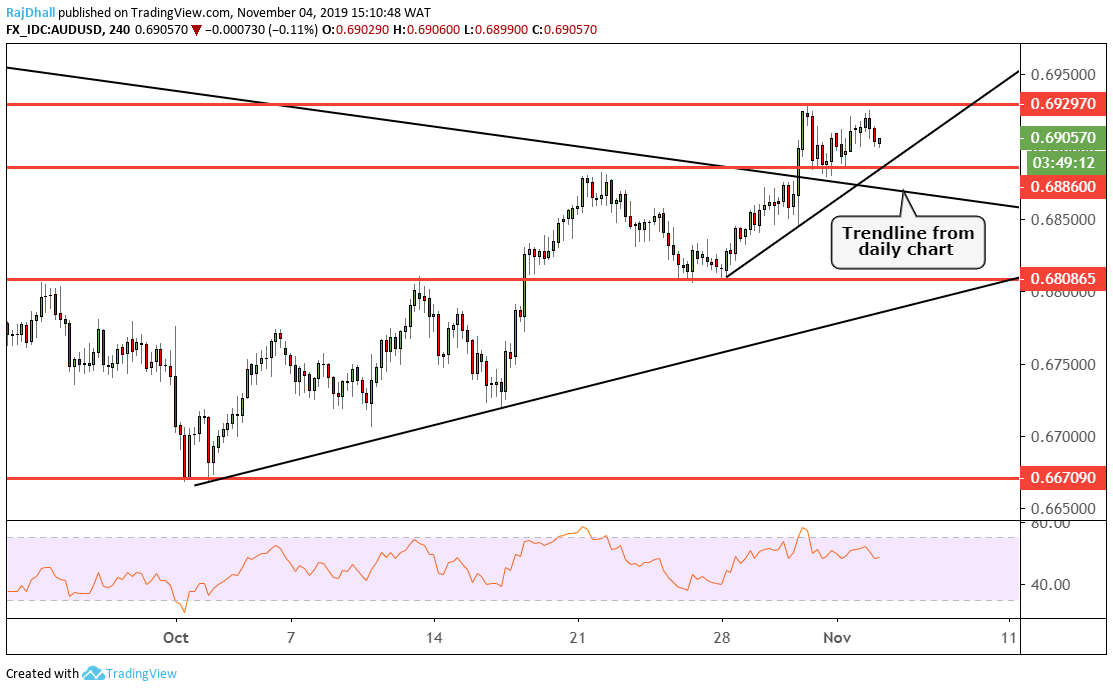
- The trendline on the daily chart has been breached and it could signal more upside.
- On the smaller timeframes the price action has also turned positive.
The daily chart is showing signs of strength despite the mammoth downtrend lasting around twenty-three months.
The price has stopped at a resistance level which was used as support back in July’19 and has now bounced lower.
The futures market has been slowing down on their projections of a rate cut from both central banks.
Interestingly the pullback from the downtrend has been attributed to the softening of the trade war stance.
This afternoon we can expect the usual stock market pump from Tweeting Mr Donald Trump.

On the four hour chart, the RSI is indicating that momentum is showing down. Although the price didn’t make a higher high wave the indicator made more of a lower high than the price.
If the price stays where it is now or closes lower the bears who look at candles would be happy about the shooting start candle.
Often when there is a break of a trendline the price will often come back to retest the level. This means we could be in for some short term weakness.
On the options front, the implied vol skew is still tilted toward the downside but it has been for some time.
Later today we are still to get some data from the US in the form of factory orders and we are also due to get some comment from new ECB President Lagarde and maybe this will inspire some volatility.