- Crude oil is pressuring the November highs ahead of the API data.
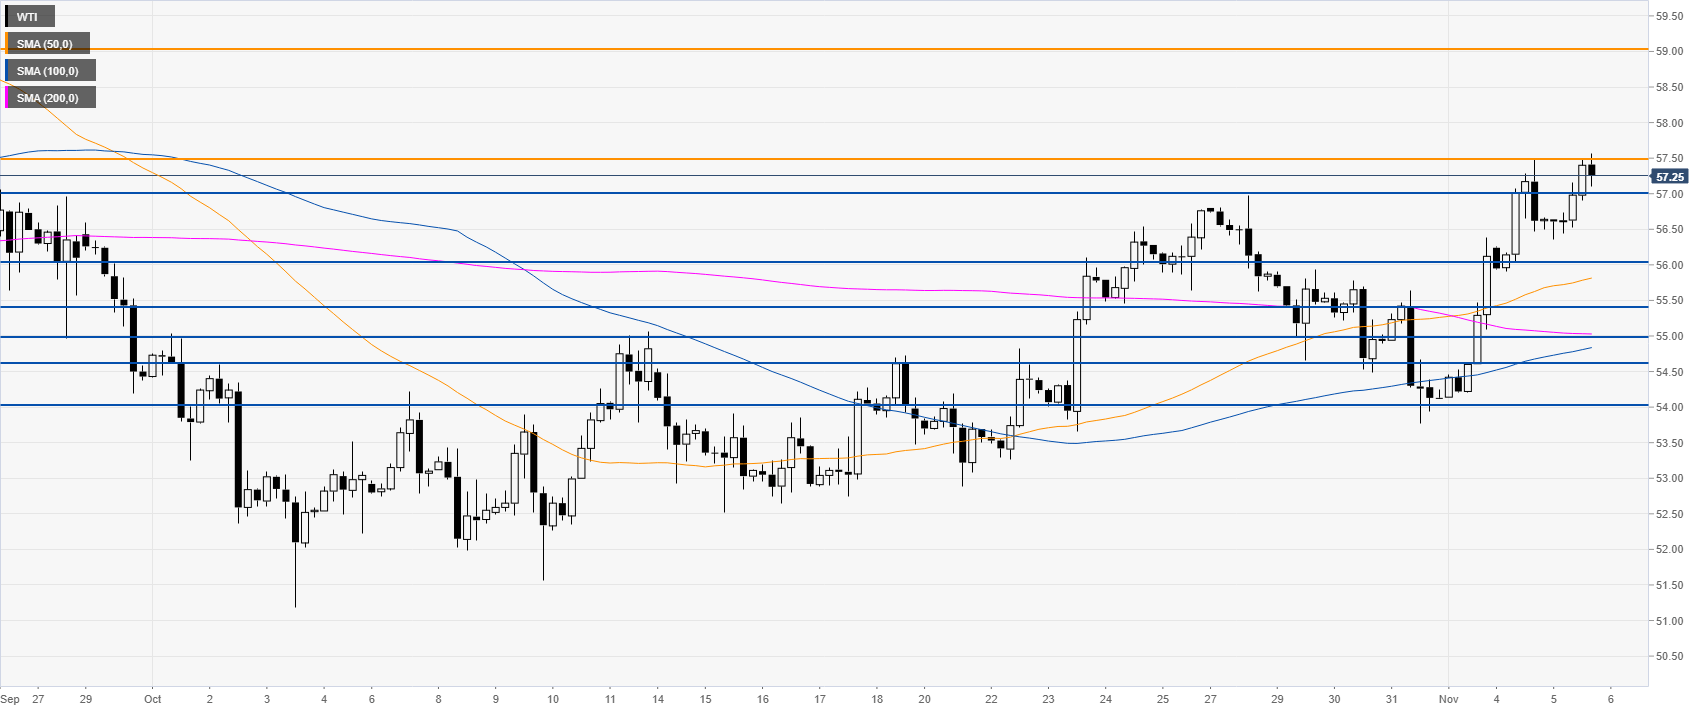
- The level to beat for bulls is the 57.50 resistance. The target can become the 59.00 handle if broken.
Crude oil daily chart
The crude oil West Texas Intermediate (WTI) is challenging $57.50 a barrel and the 200-day simple moving average (DMA). The API data is scheduled for 21:30 GMT. While this news is usually less market-moving than the EIA, it still has the potential to create volatility.

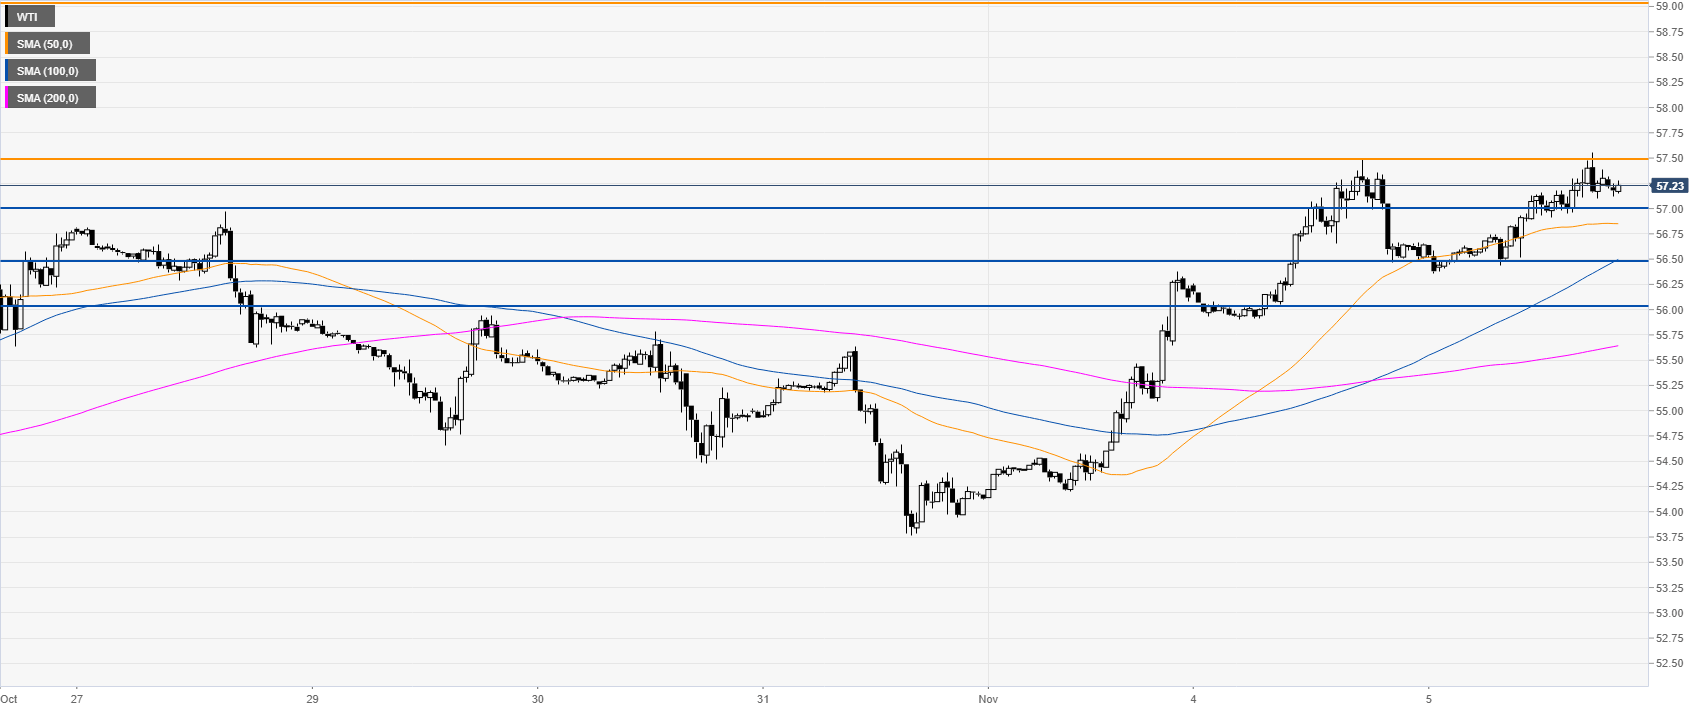
Crude oil four-hour chart
The 57.50 target has been reached. The market, for now, seems reluctant to break above the level. However, a daily close above 57.50 can lead to further strength to the 59.00 handle.
Crude oil 30-minute chart
WTI is trading above its main SMA, suggesting bullish momentum in the near term. Support can be seen at the 57.00 and 56.50 and 56.00 price levels.
Additional key levels
