- EUR/GBP is chopping just above the 0.8600 figure this Wednesday.
- The level to beat for sellers is the 0.8600 figure.
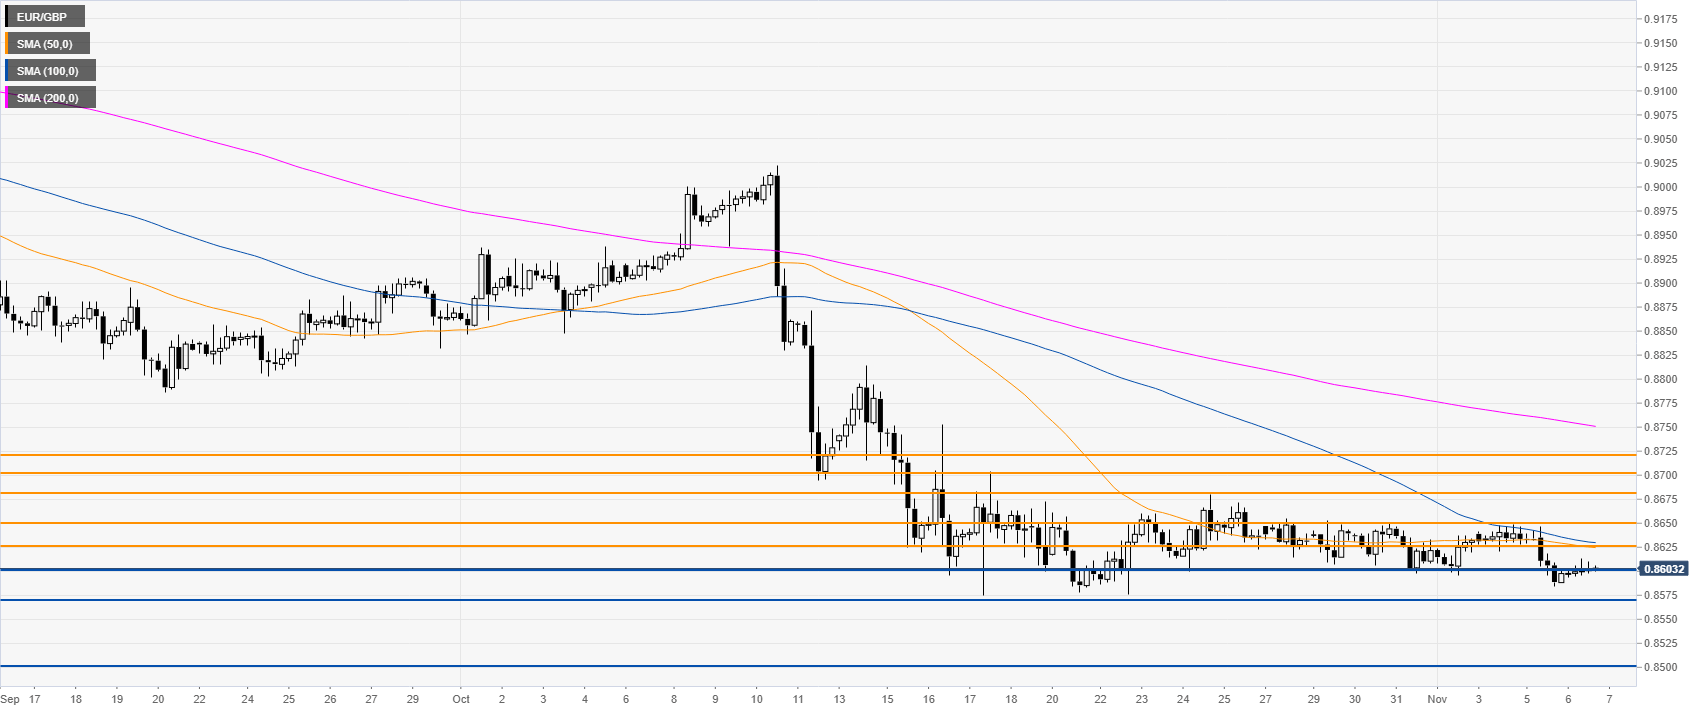
EUR/GBP daily chart
On the daily chart, EUR/GBP is trading in a downtrend below its main daily simple moving averages (DMAs). In the last weeks of trading, the optimism of a Brexit deal drove the spot to the 0.8600 figure.

EUR/GBP four-hour chart
EUR/GBP is trading below near the 0.8600 figure and below its main SMAs, on the four-hour chart, suggesting a bearish bias in the medium term. A close below the 0.8575 support level on a daily closing basis should open the gates to more losses towards the 0.8500 round number on the way down, according to the Technical Confluences Indicator.
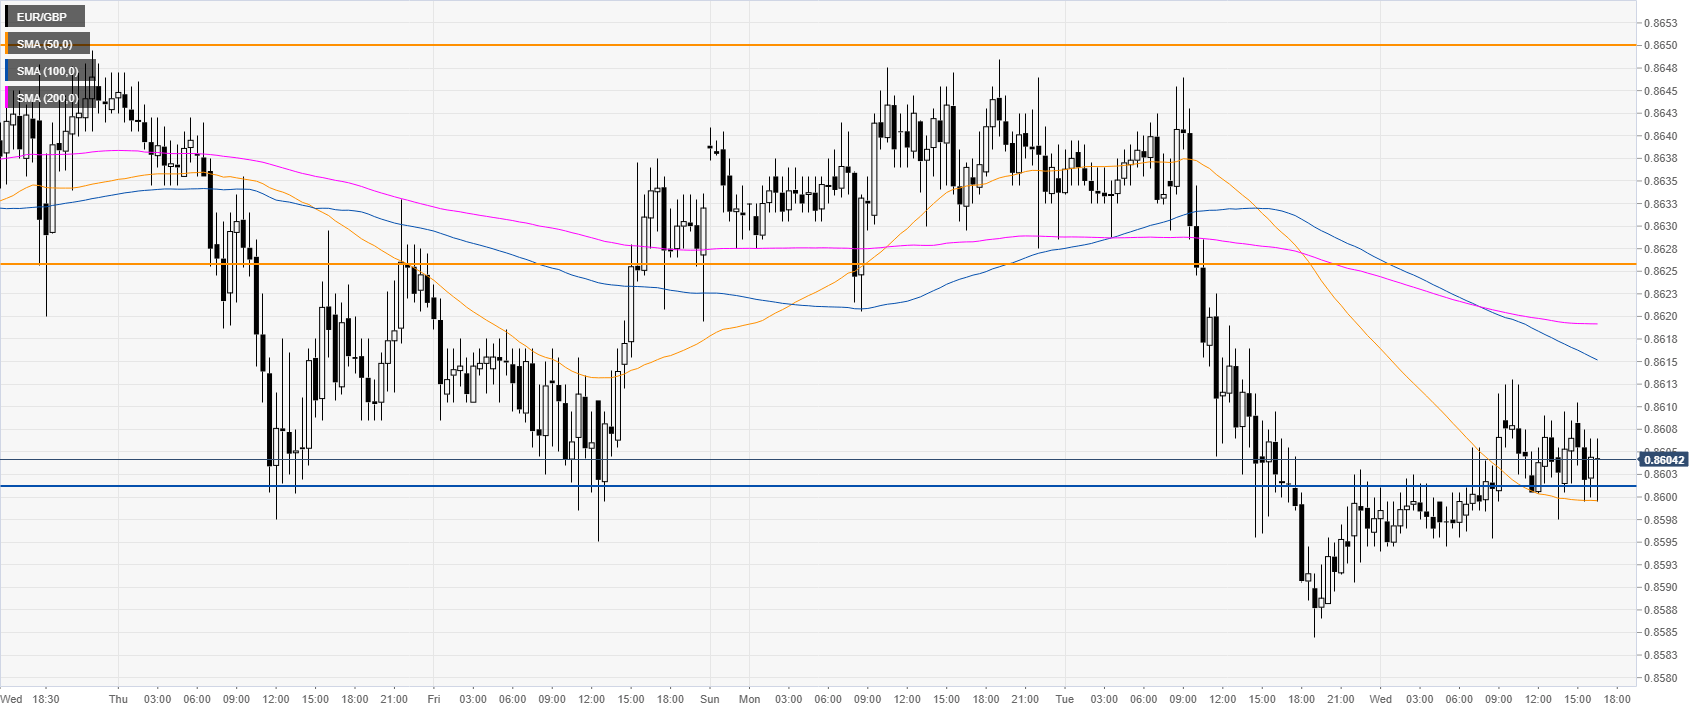
EUR/GBP 30-minute chart
EUR/GBP is trading below the downward sloping and 100 and 200 SMAs, suggesting a bearish bias ain the near term. The market is trying to find some support at the 0.8600 handle. However, a break below it can lead to the 0.8570 level and the 0.8500 figure. Resistance is seen at the 0.8626 and 0.8650 price levels.
Additional key levels
