- DXY is breaking above the 98.00 handle in the New York session.
- Resistance is seen at the 98.30 and 98.65 price levels.
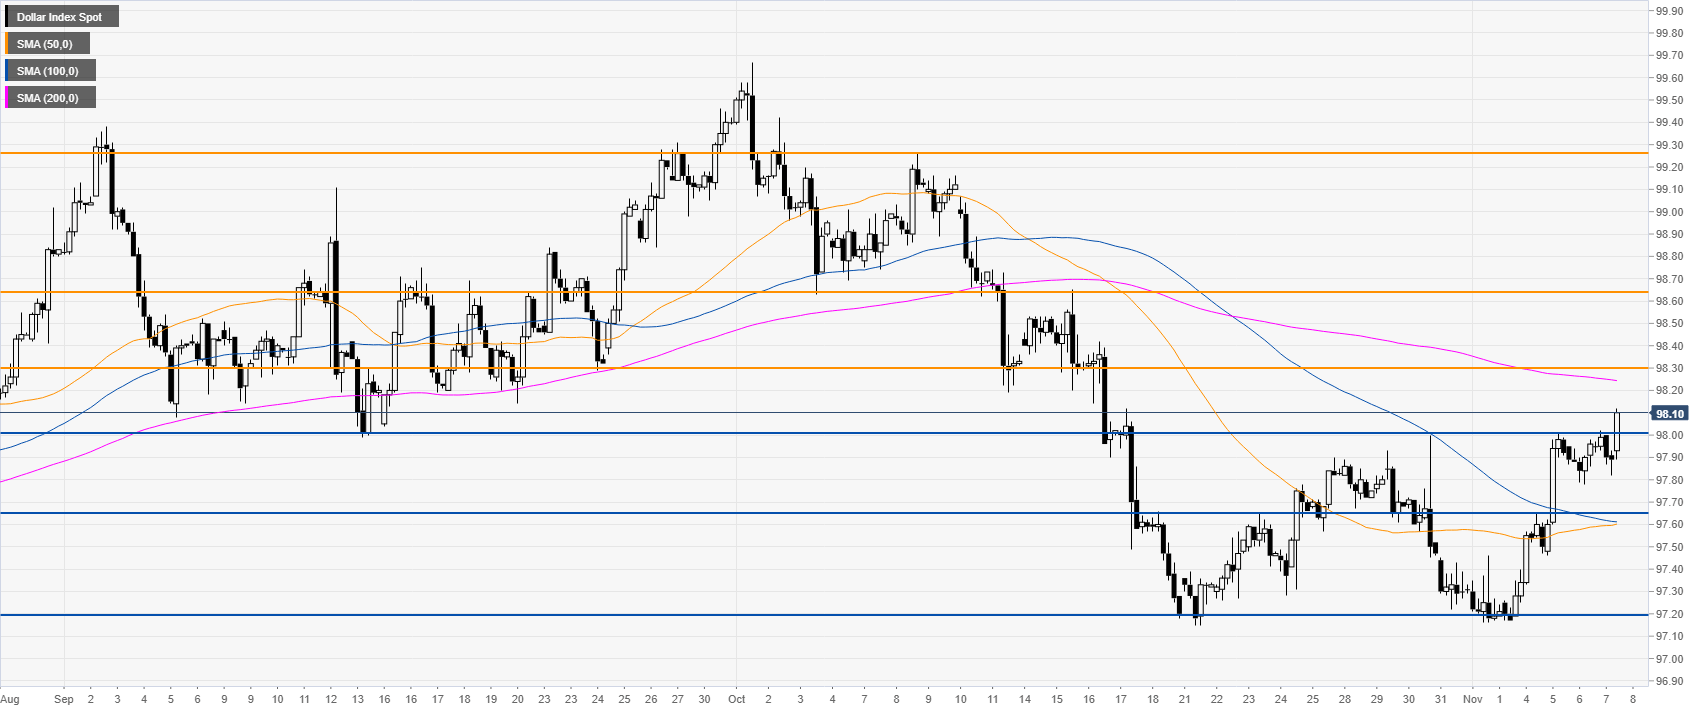
DXY daily chart
DXY (US Dollar Index) is trading in a bull trend above the 100 and 200 DMAs. This Thursday the Greenback is breaking above the 98.00 handle, trading now at its highest in 14 trading sessions.

DXY 4-hour chart
The Greenback is trading above its 50 and 100 SMAs after a double bottom formation. The break above the 98.00 resistance can lead to further gains towards the 98.30, 98.65 and the 99.26 resistance levels.
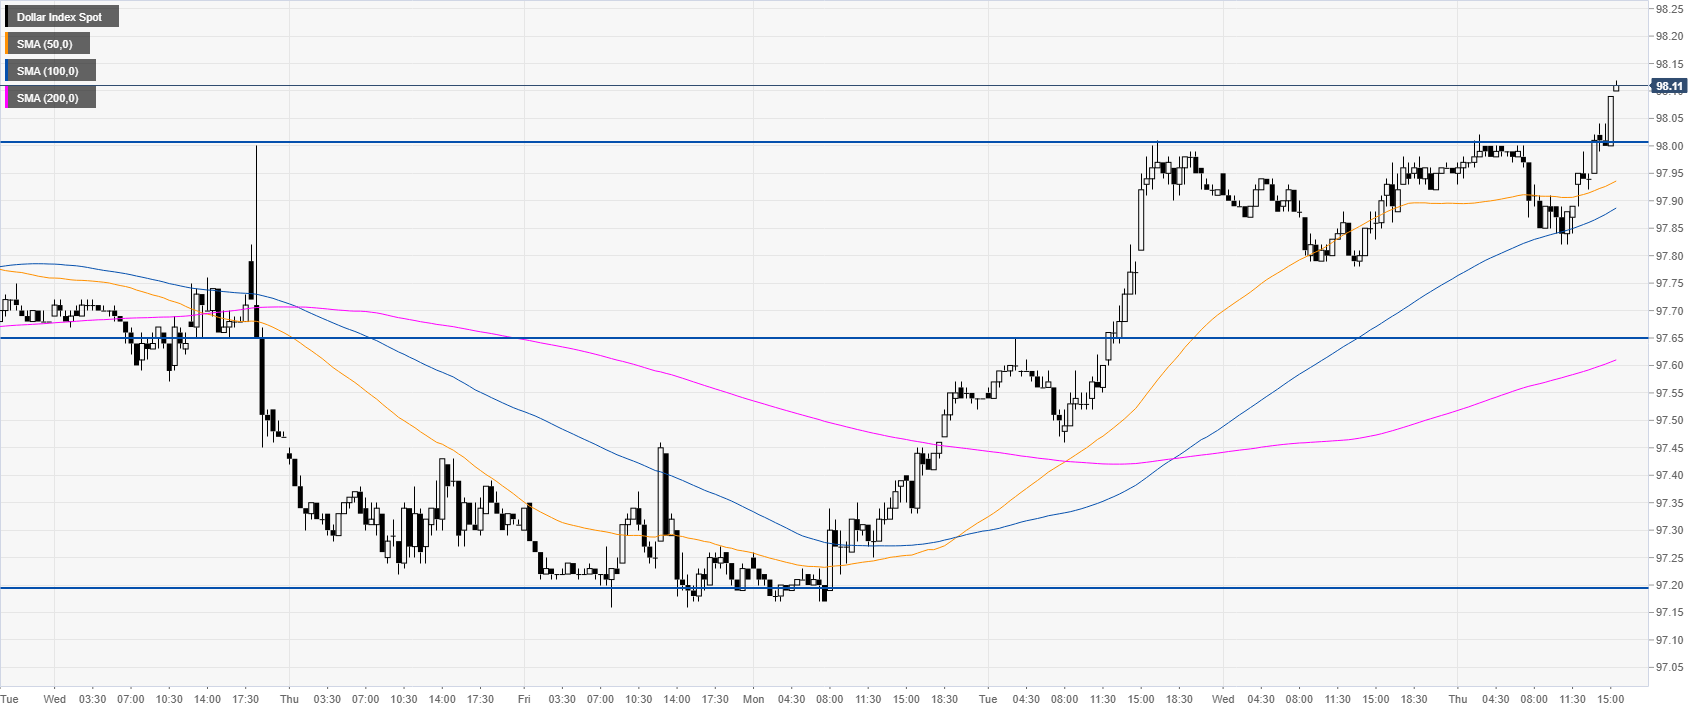
DXY 30-minute chart
DXY is trading above the main SMAs, suggesting a bullish bias in the short term. Support is seen at the 98.00, 97.80 and 97.65 levels.
Additional key levels
