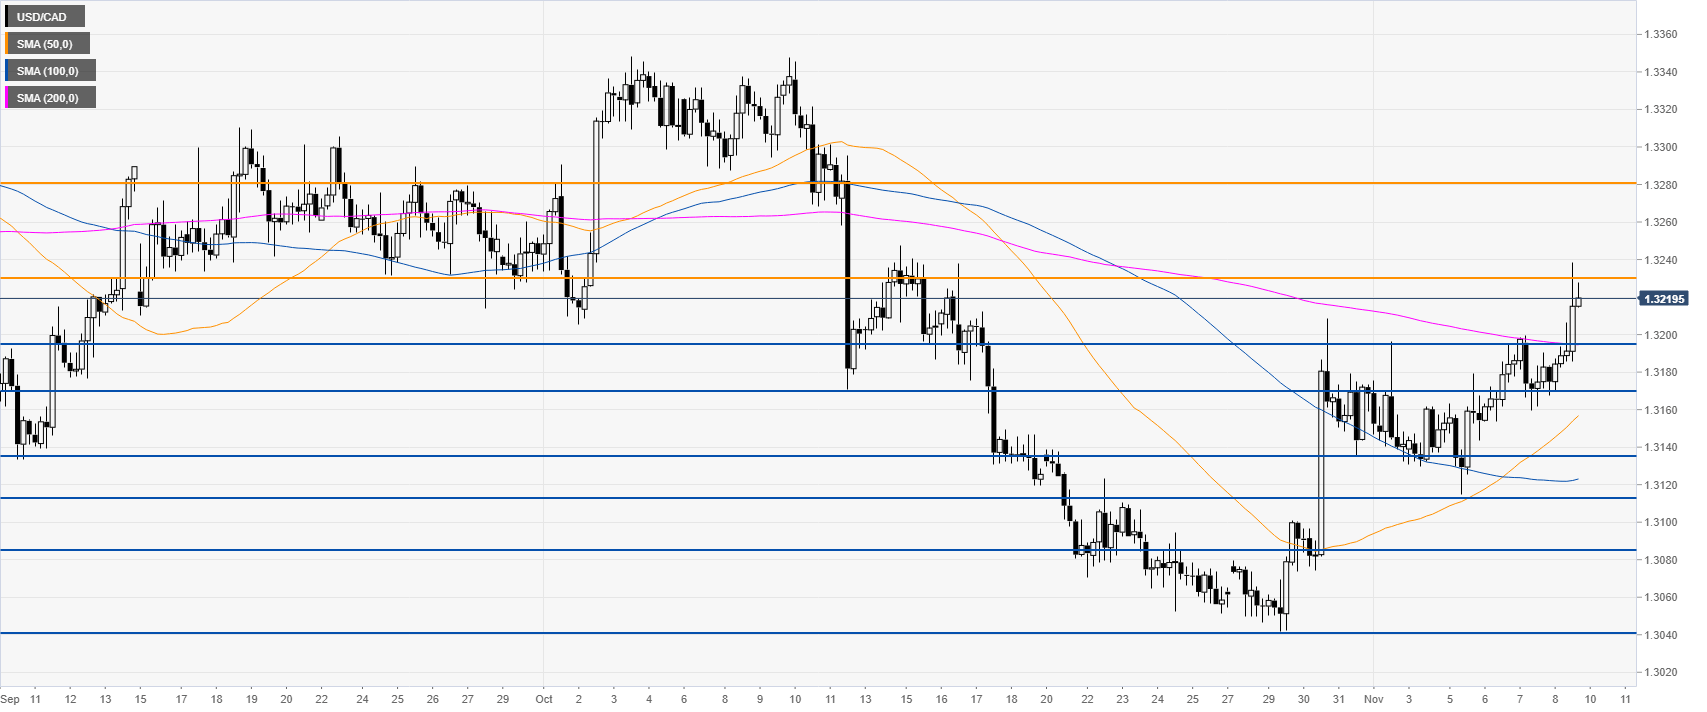
- USD/CAD is trading at levels not seen since mid-October.
- The level to beat for bulls is the 1.3230 resistance.
USD/CAD daily chart
The Loonie on the daily chart is rising above the 1.3200 handle and the 50/100-day simple moving averages (DMAs). This Friday, the market spiked to its highest since mid-October.

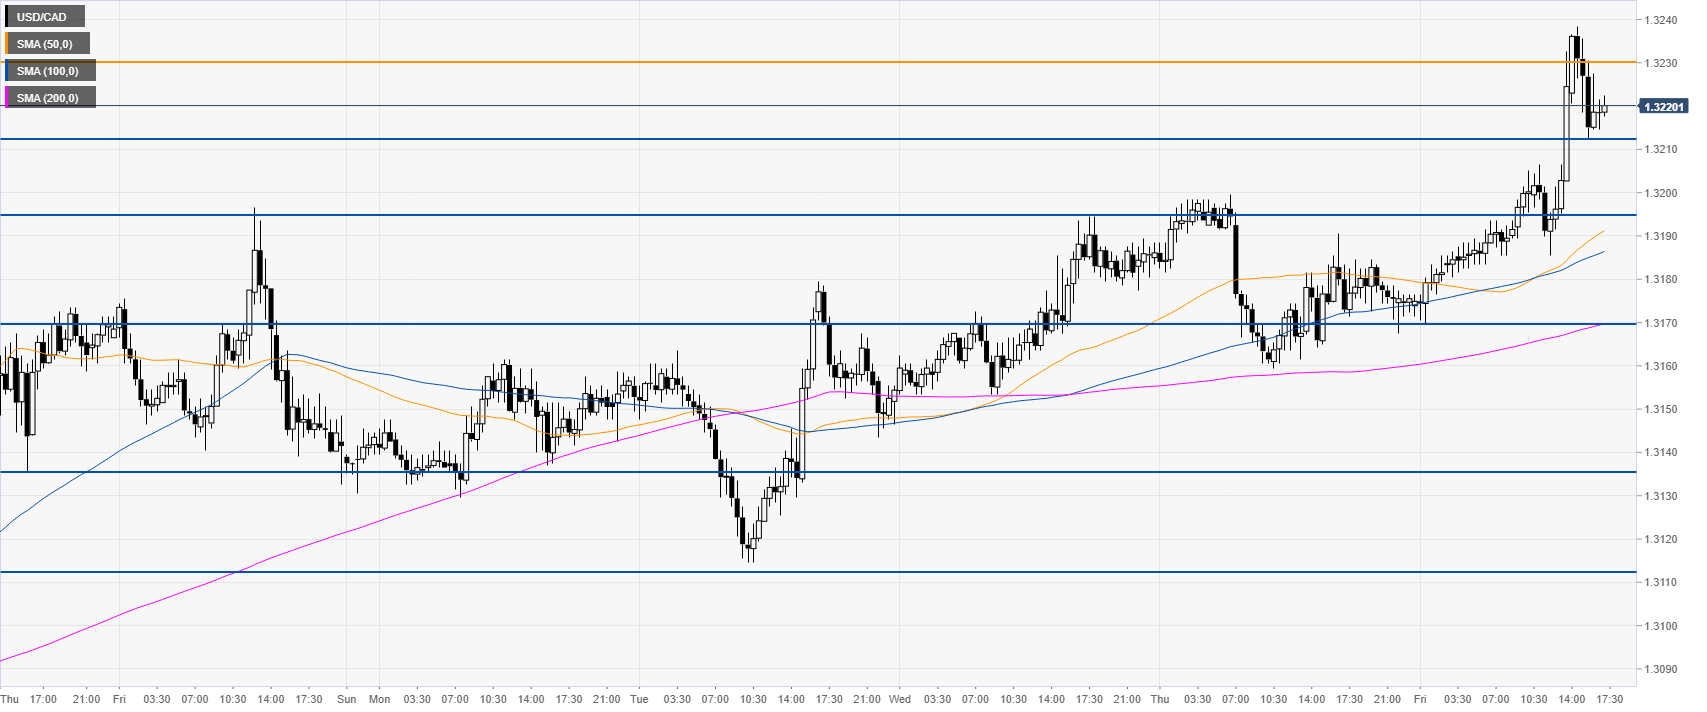
USD/CAD four-hour chart
USD/CAD is trading above its main SMAs adding strength to the bull case. Buyers should break above the 1.3230 resistance to reach the 1.3280 level on the way up, according to the Technical Confluences Indicator.
USD/CAD 30-minute chart
USD/CAD is trading above its main SMAs, suggesting bullish momentum in the near term. Support is seen at the 1.3212 level followed by 1.3195 and 1.3170, according to the Technical Confluences Indicator.
Additional key levels
