- GBP/USD is starting the week with a big leap to the 1.2900 handle.
- Support is seen at the 1.2835 and 1.2795 levels.
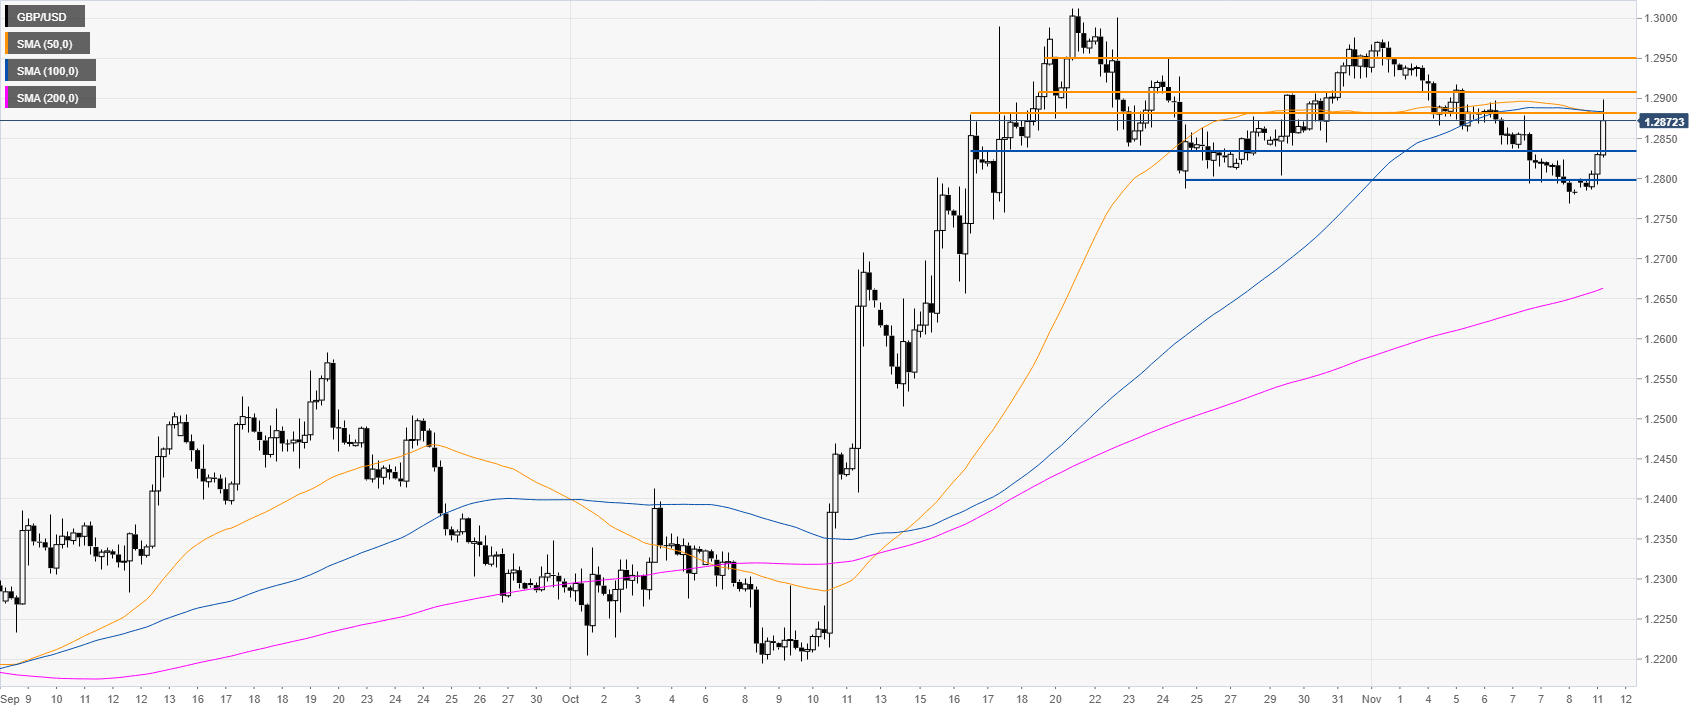
GBP/USD daily chart
The Cable, In October, had a run to levels not seen since mid-May 2019. The market is correcting the advance in the 1.2800-1.3000 zone.

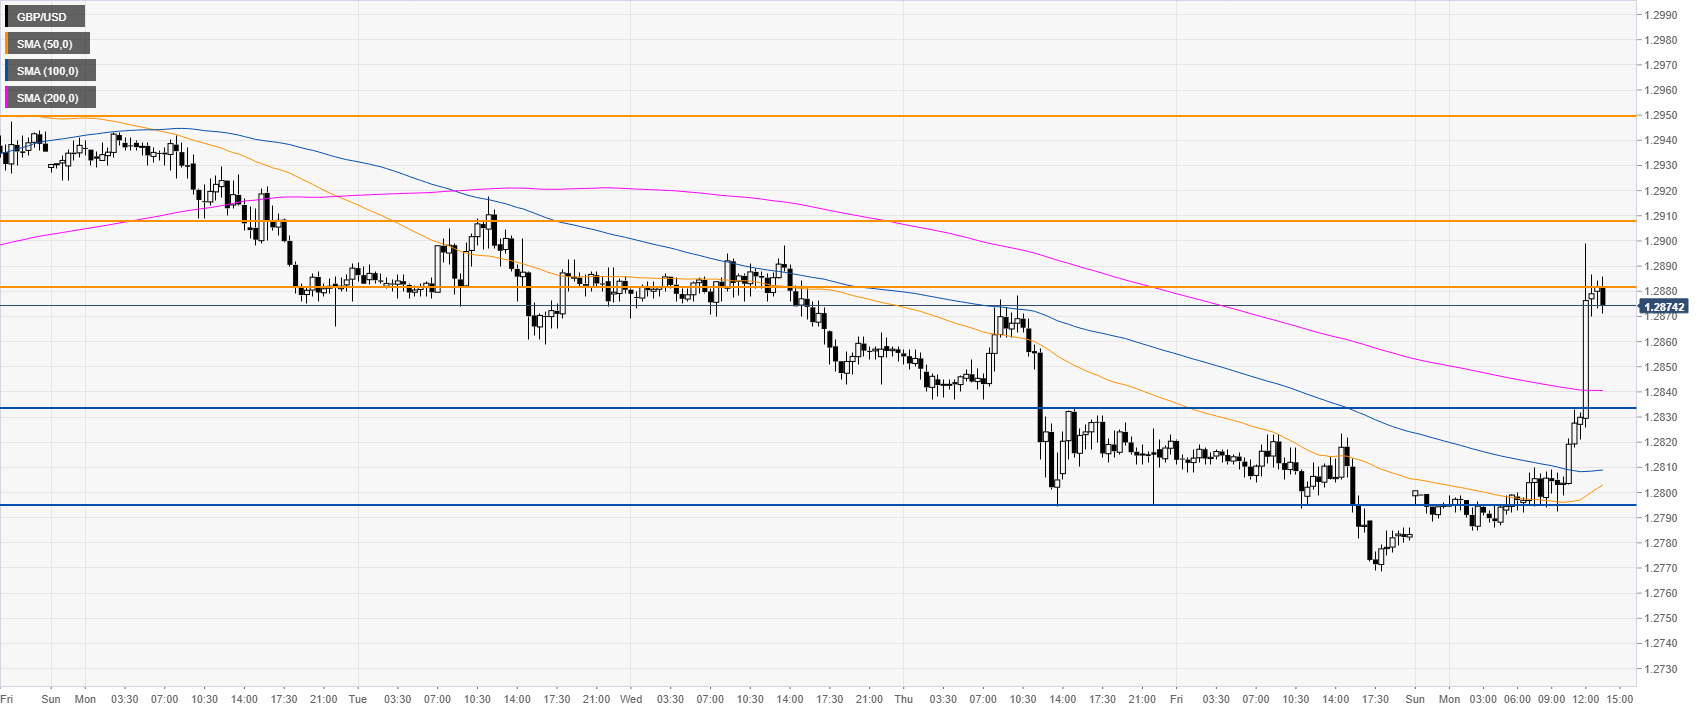
GBP/USD four-hour chart
GBP/USD is challenging the 1.2882/1.2900 resistance zone close to the 50 and 100 SMAs. Buyers will need to overcome this area in order to climb towards the 1.2950 resistance, according to the Technical Confluences Indicator.
GBP/USD 30-minute chart
Sterling/Dollar is trading above downward sloping SMAs, suggesting a potential bullish bias in the near term. Immediate support is seen at the 1.2835 followed by 1.2795, according to the Technical Confluences Indicator.
Additional key levels
