- The cable is turning negative for the week.
- The level to beat for sellers is the 1.2820 support.
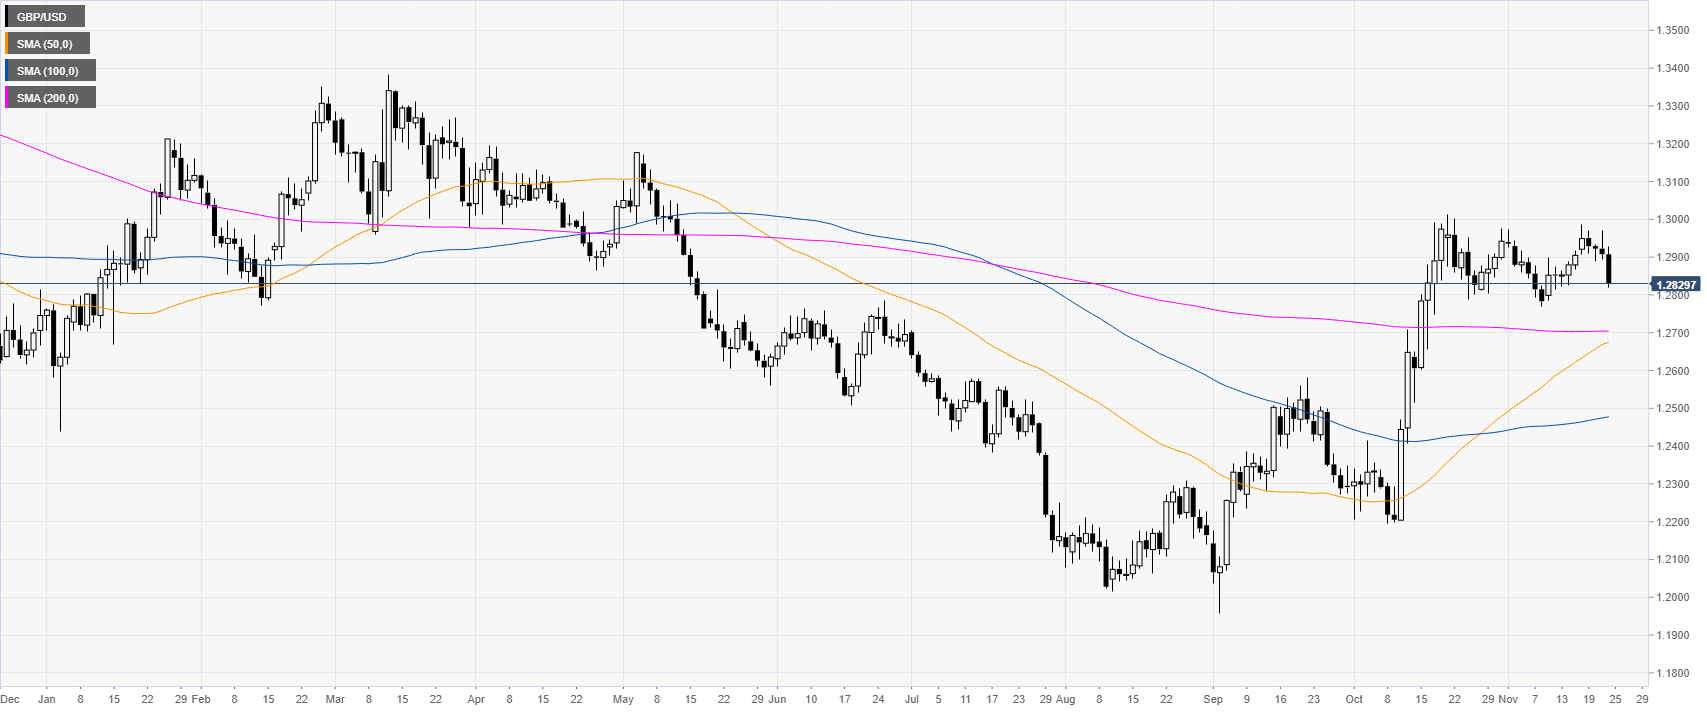
GBP/USD daily chart
GBP/USD is rejecting the 1.2900 handle as the market is easing from the November highs. The spot is trading well above its main daily simple moving averages (DMAs).
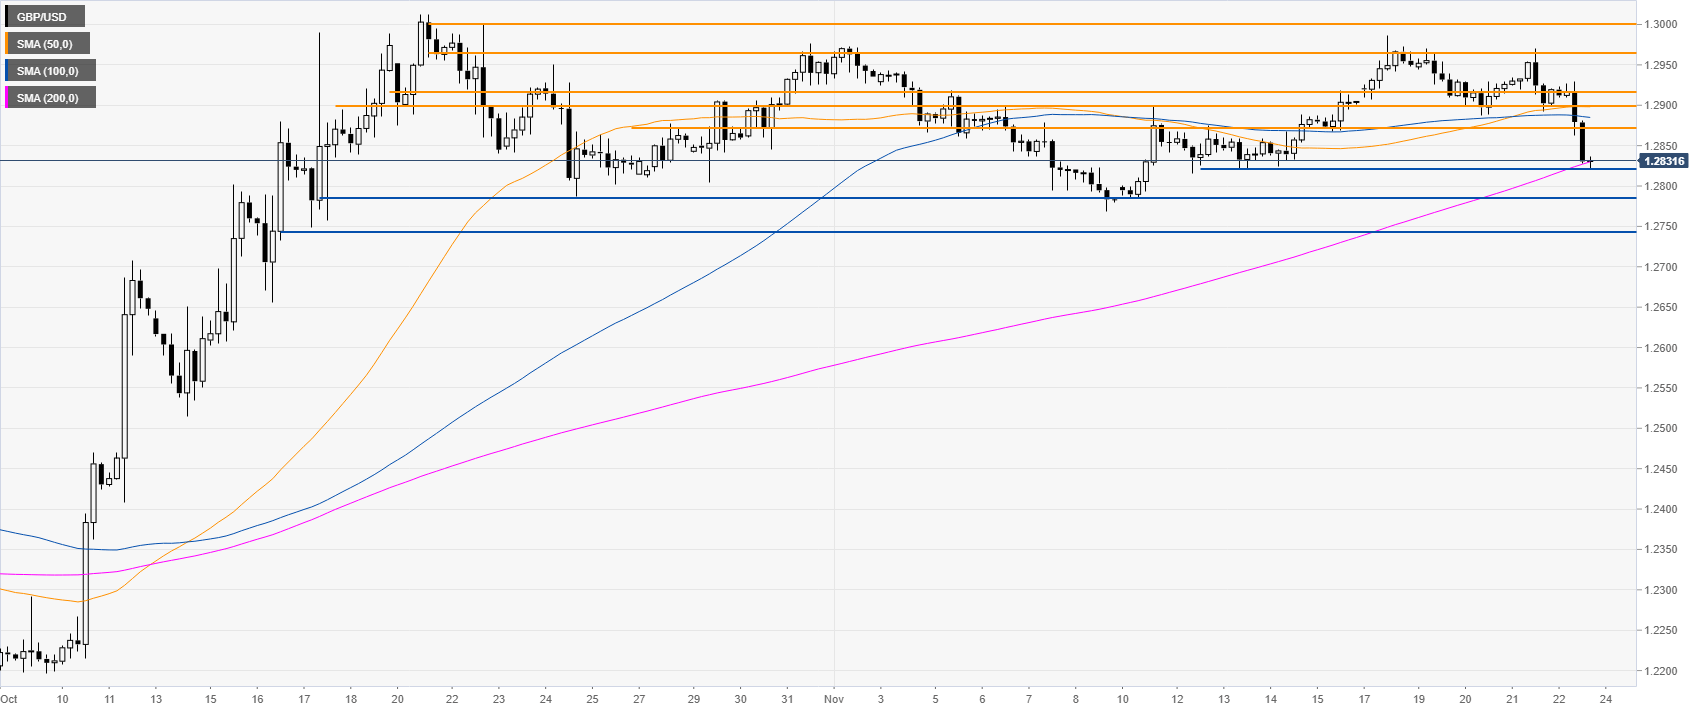
GBP/USD four-hour chart
The market is challenging the 1.2821 support and the 200 SMA. A break below the level next week could lead to further losses towards the 1.2788 and 1.2741 price levels, according to the Technical Confluences Indicator.
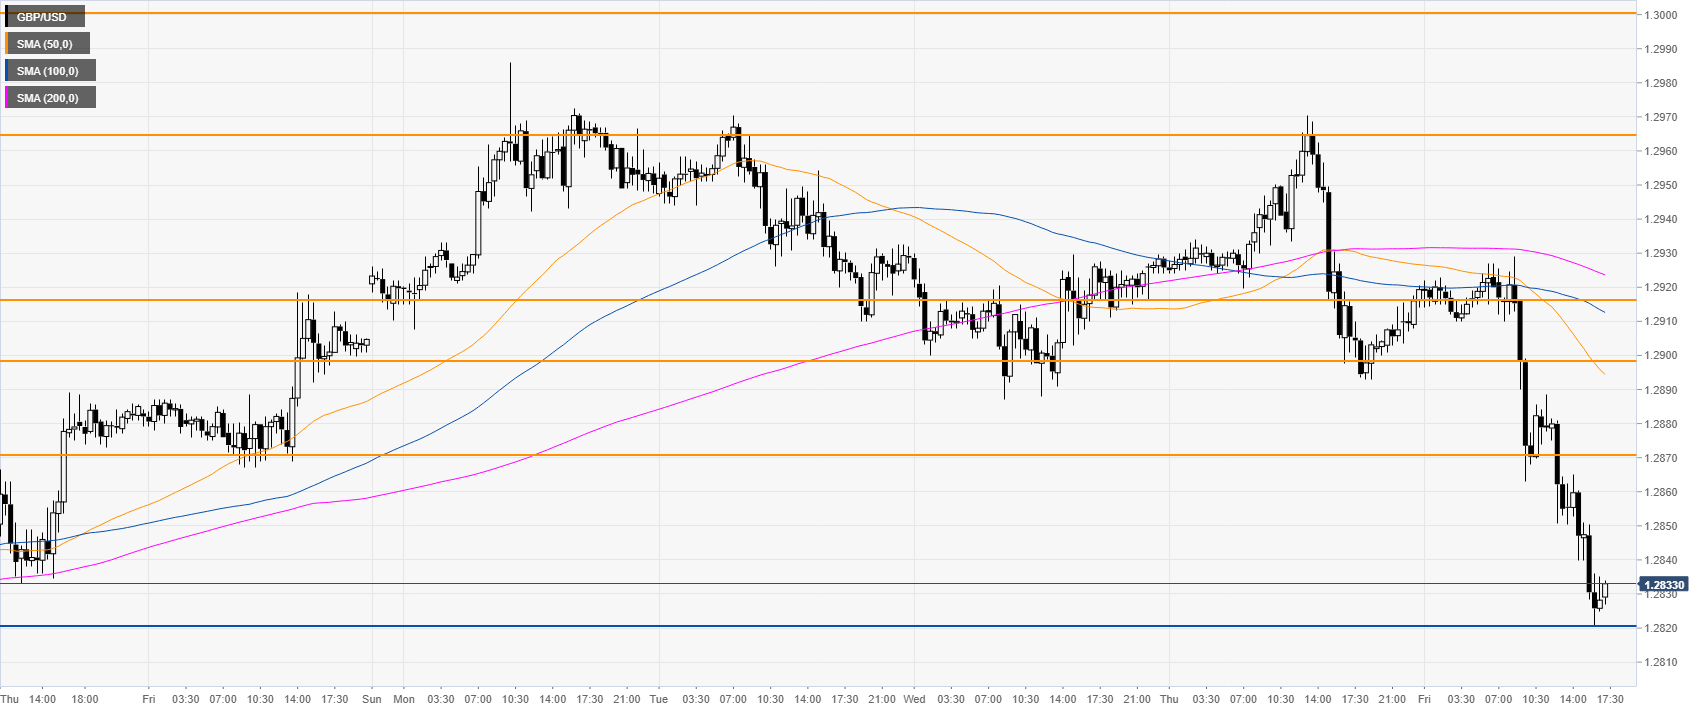
GBP/USD 30-minute chart
The market is trading below the main SMAs, suggesting a bearish bias in the near term. Resistance is seen at the 1.2870 and 1.2900 price levels.
Additional key levels
