- Following its latest recovery, USD/CHF rises to the highest since the previous Tuesday.
- 200-day SMA and multi-week-old resistance line hold the key to pair’s run-up towards 1.0000 mark.
- 0.9870 can entertain short-term sellers.
Based on its U-turn from 0.9870, the USD/CHF pair current takes the bids to the highest in eight-day while trading around 0.9940 during early Friday.
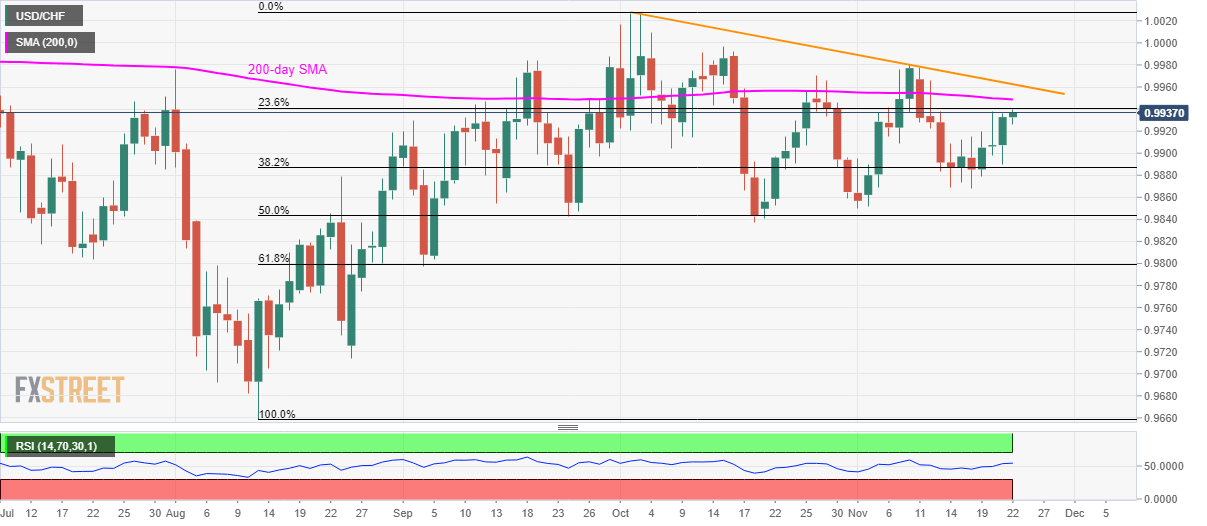
However, 200-day Simple Moving Average (SMA) and a downward sloping trend line since October-starts, around 0.9950 and 0.9965 respectively, stand tall to challenge buyers.
It’s worth mentioning that the pair’s run-up beyond 0.9965 enables it to claim 1.0000 round-figure whereas the previous month high close to 1.0030 could challenge bulls then after.
Should prices take a U-turn from the present levels, 0.9870 can act as nearby key support ahead of October month low near 0.9835.
Additionally, the pair’s extended downpour beneath 0.9835 emphasizes on 0.9800/0.9795 area including September bottom and 61.8% Fibonacci retracement of August-October upside.
USD/CHF daily chart
Trend: Pullback expected
