- USD/CAD is about to roll into the Asian session near the 1.3300 figure.
- The level to beat for bulls is the 1.3341/1.3354 resistance zone.
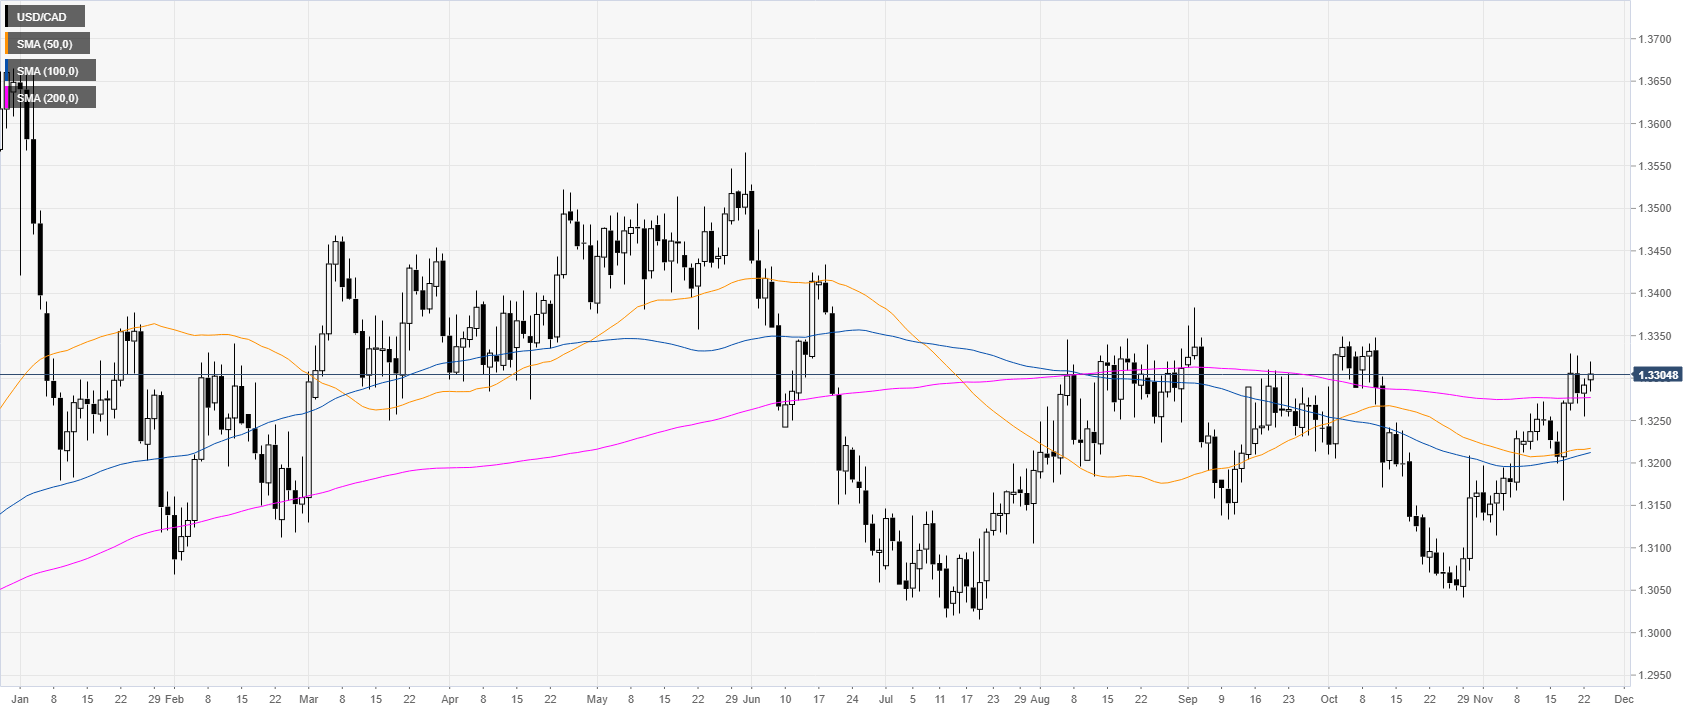
USD/CAD daily chart
The loonie on the daily chart is trading near the November highs while above the main daily simple moving averages (DMAs). The market is likely to keep appreciating from here.
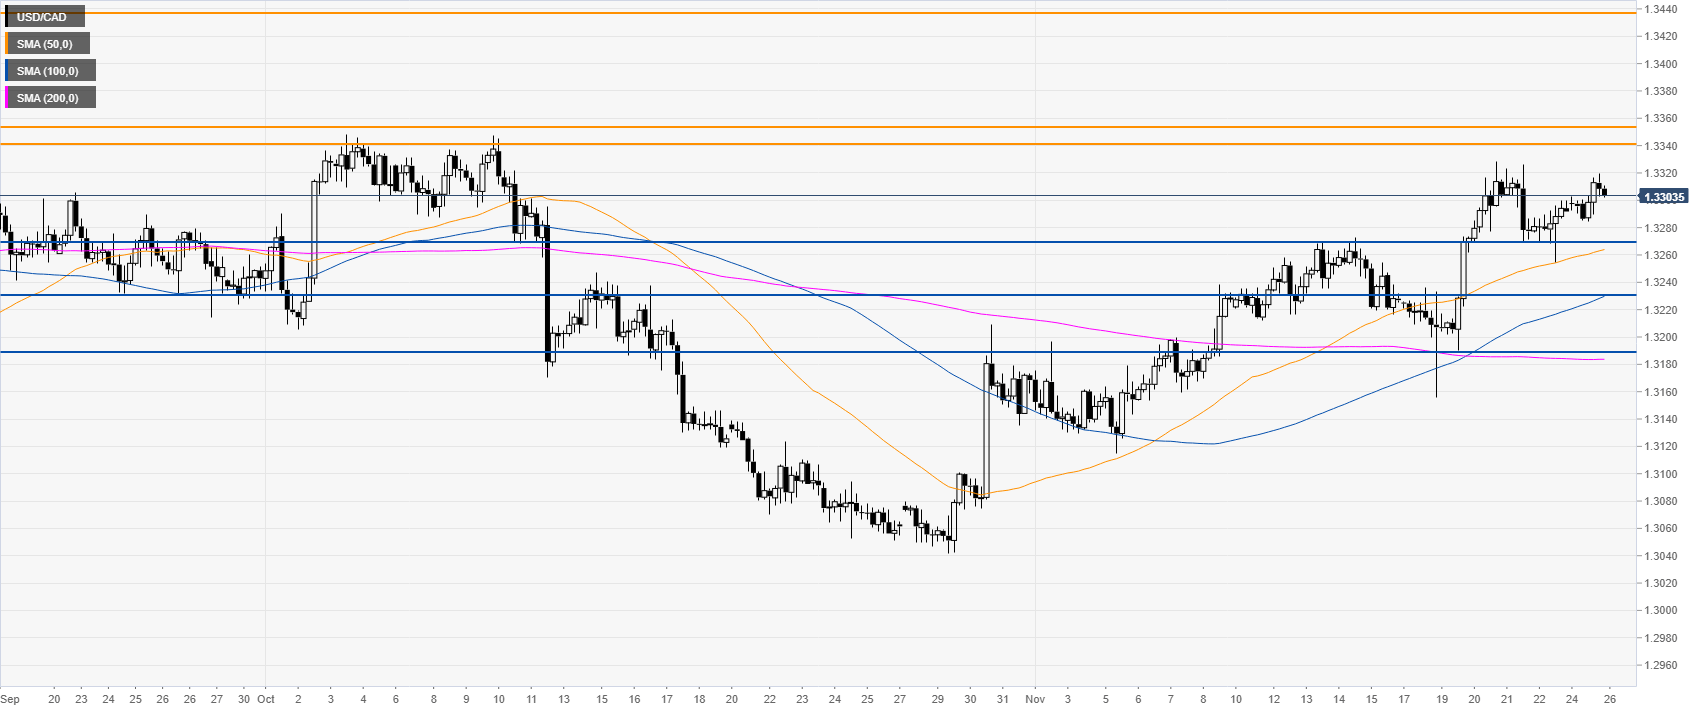
USD/CAD four-hour chart
USD/CAD is evolving above the main SMAs, suggesting bullish momentum in the medium term. A break above 1.3341/1.3354 resistance zone can see the market accelerates towards 1.3437 in the medium term, according to the Technical Confluences Indicator.
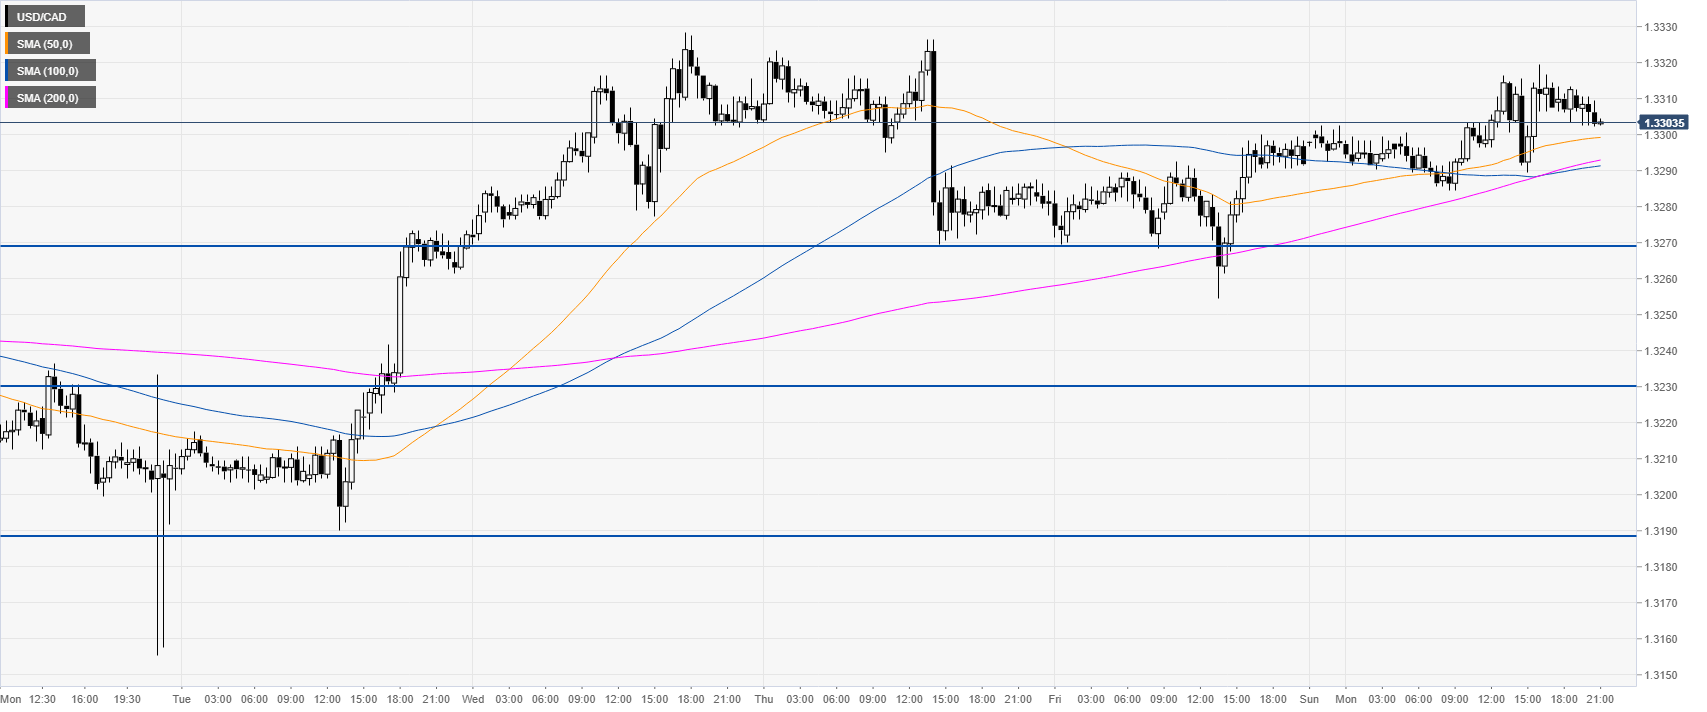
USD/CAD 30-minute chart
USD/CAD is trading above its main SMAs, suggesting a bullish bias in the near term. Support is seen at the 1.3271 and 1.3230 price levels, according to the Technical Confluences Indicator.
Additional key levels
