- The aussie remains under pressure in the New York session.
- The level to beat for sellers is the 0.6773 support.
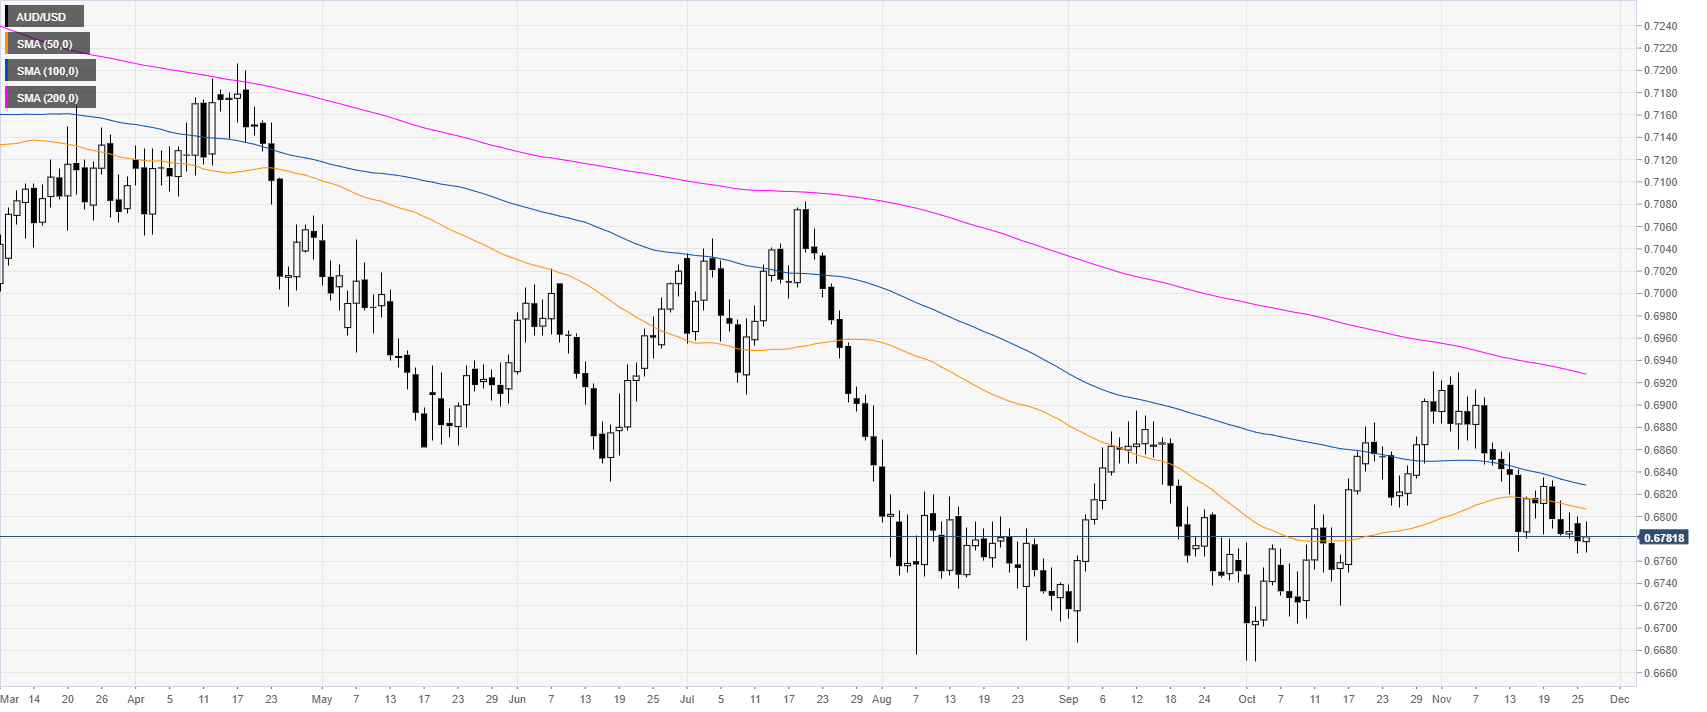
AUD/USD daily chart
The aussie is trading in a bear trend below its main daily simple moving averages (DMAs) on the daily time frame chart. The market is grinding lower, challenging last week’s lows below the 0.6800 figure.
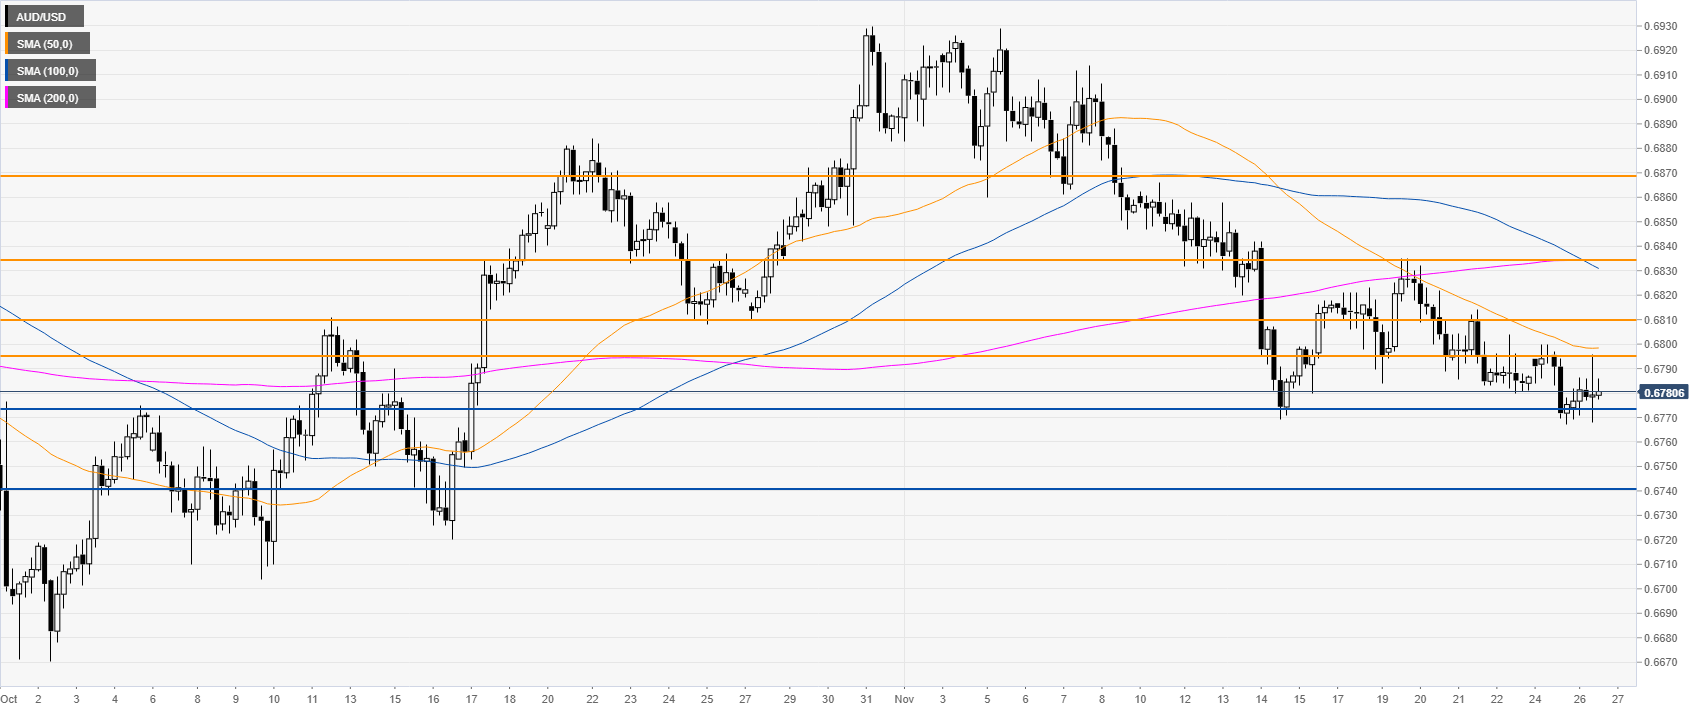
AUD/USD 4-hour chart
The market remains under heavy pressure as it is approaching the November lows. The market is trying to break below the 0.6773 (swing low), a successful breakdown below it can drive the market down to the 0.6740 level, according to the Technical Confluences Indicator.
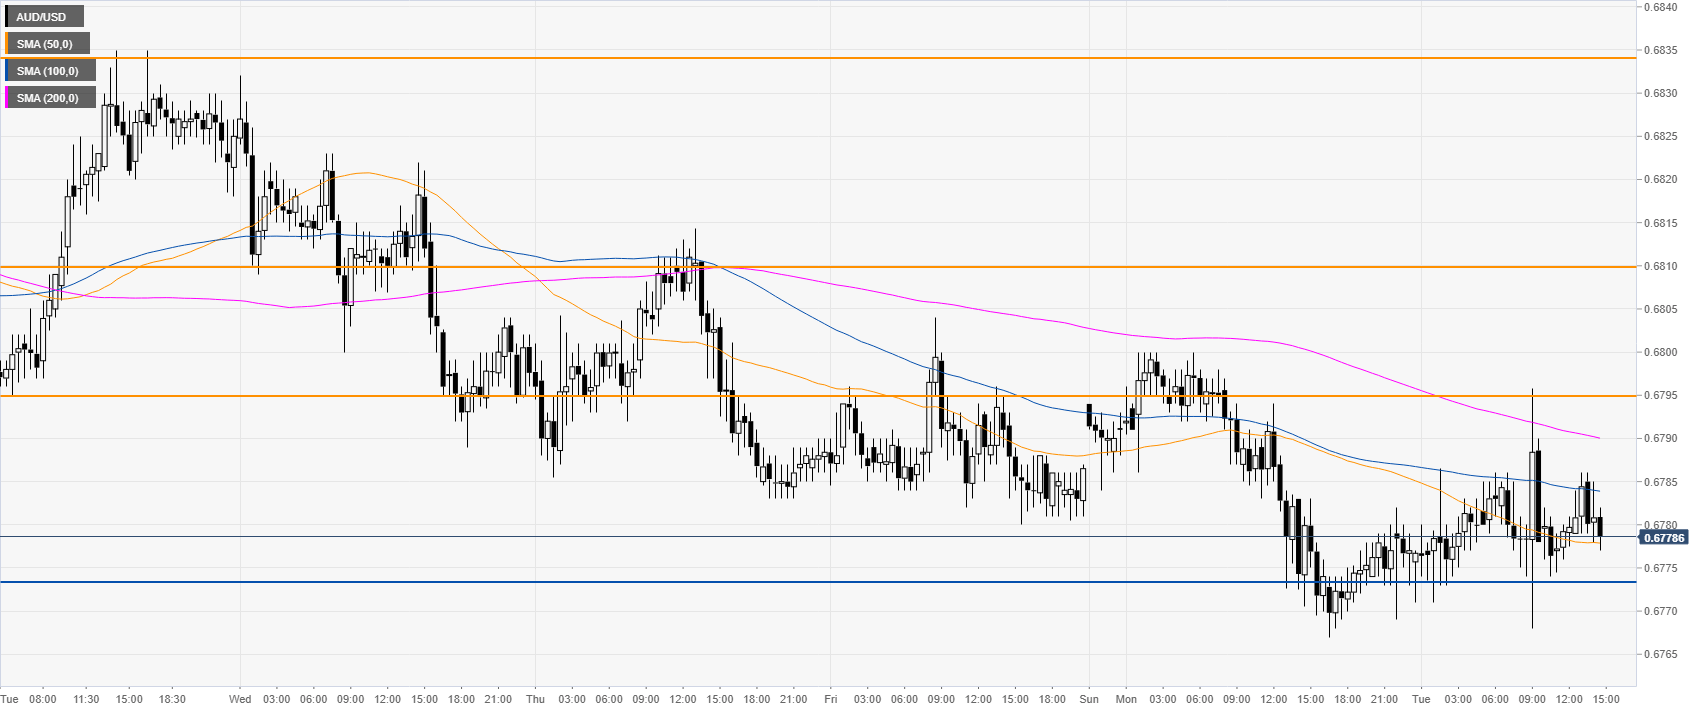
AUD/USD 30-minute chart
AUD/USD is trading below a downward sloping 100/200 SMAs, suggesting a bearish bias in the short term. Resistances can be seen at the 0.6795 and 0.6810 price levels, according to the Technical Confluences Indicator.
Additional key levels
