- The aussie is trapped in a tight trading range this week.
- The level to beat for bears is the 0.6773 swing low.
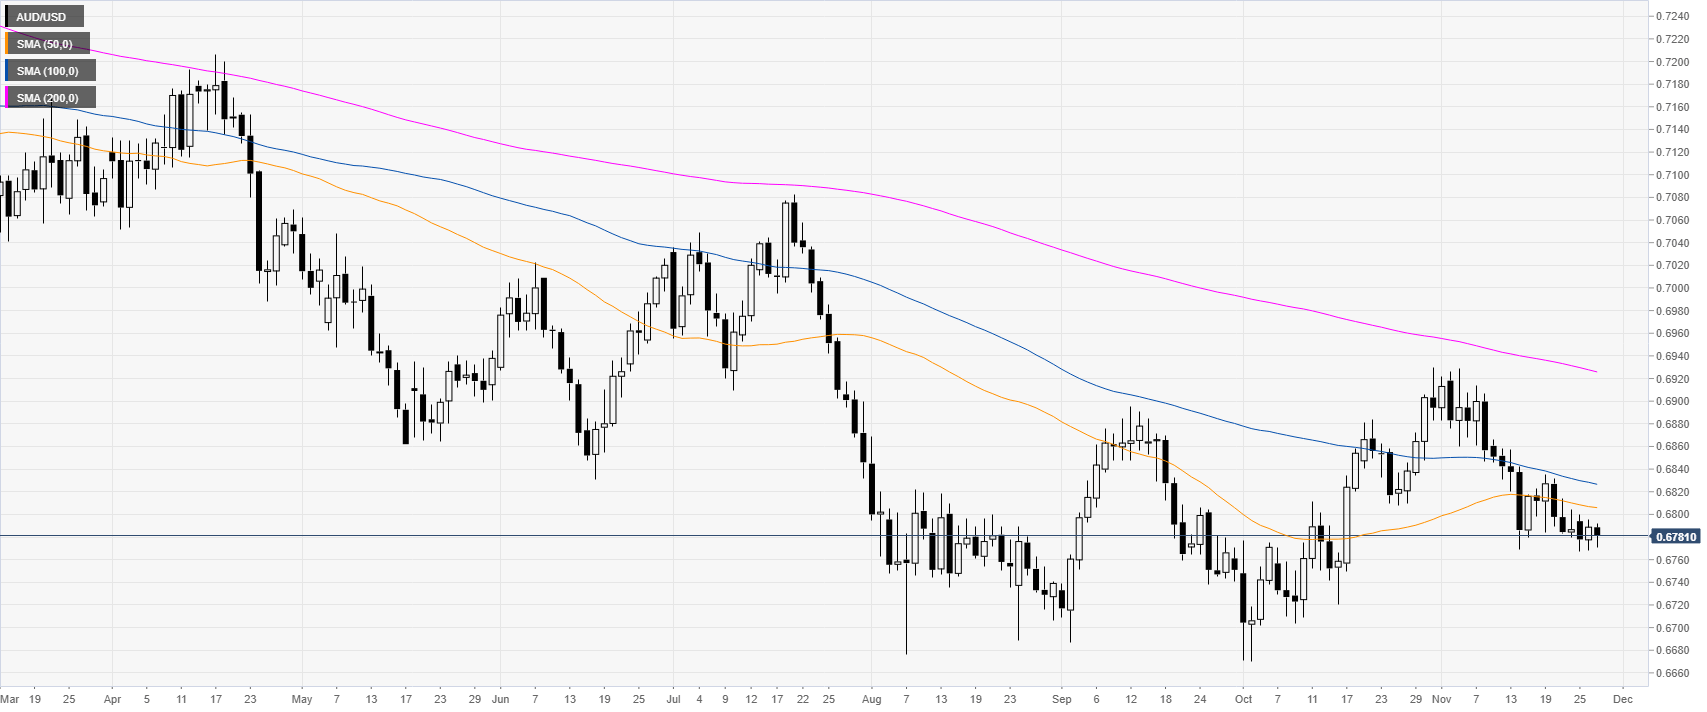
AUD/USD daily chart
The aussie is trading in a bear trend below its main daily simple moving averages (DMAs) on the daily chart. The market is trapped in a range, currently holding above the November lows.
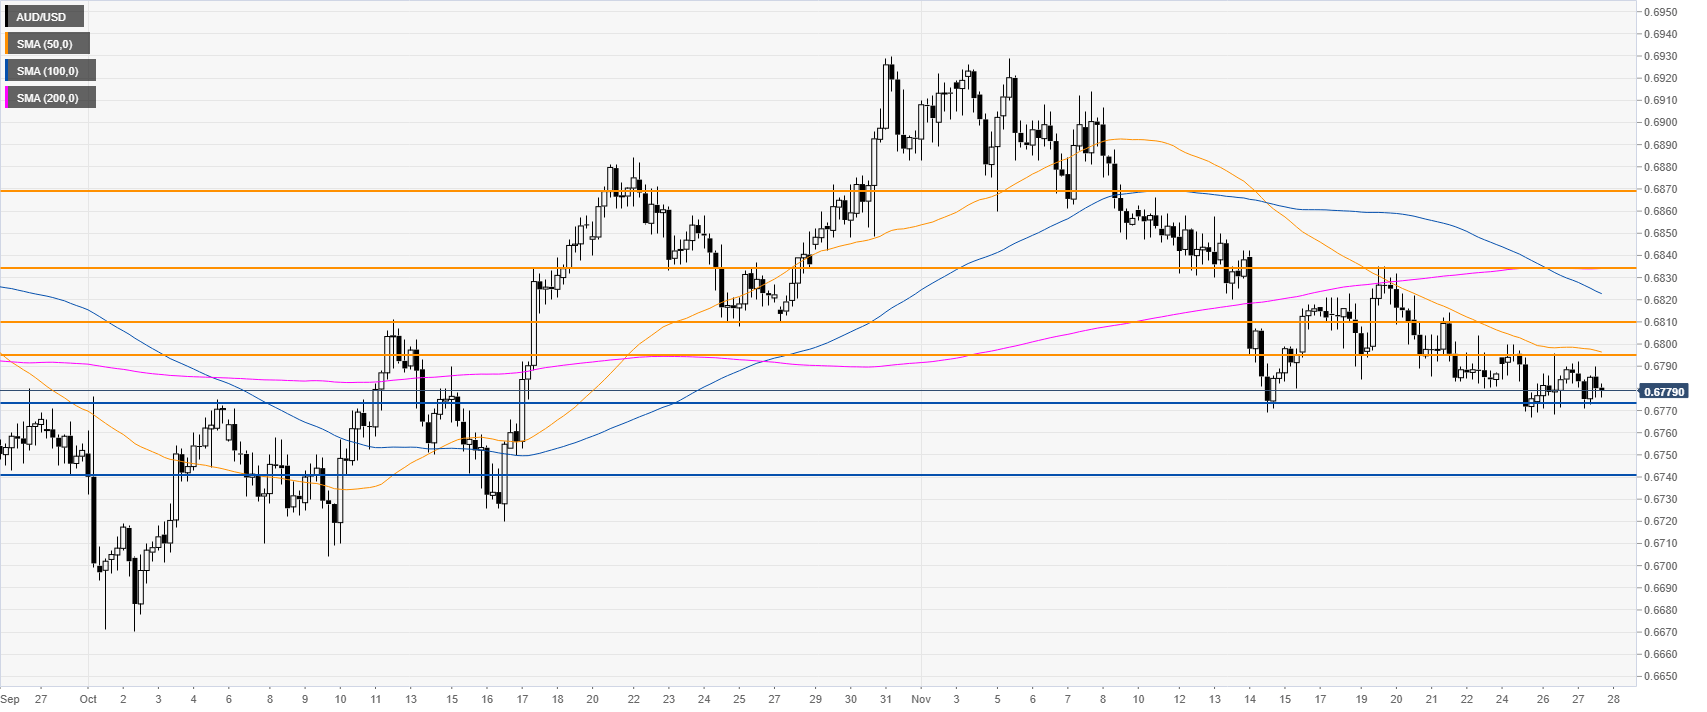
AUD/USD four-hour chart
The spot is sidelined just above the November lows. If AUD/USD breaks below the 0.6773 (swing low), the bears could send the market down to the 0.6740 level, according to the Technical Confluences Indicator.
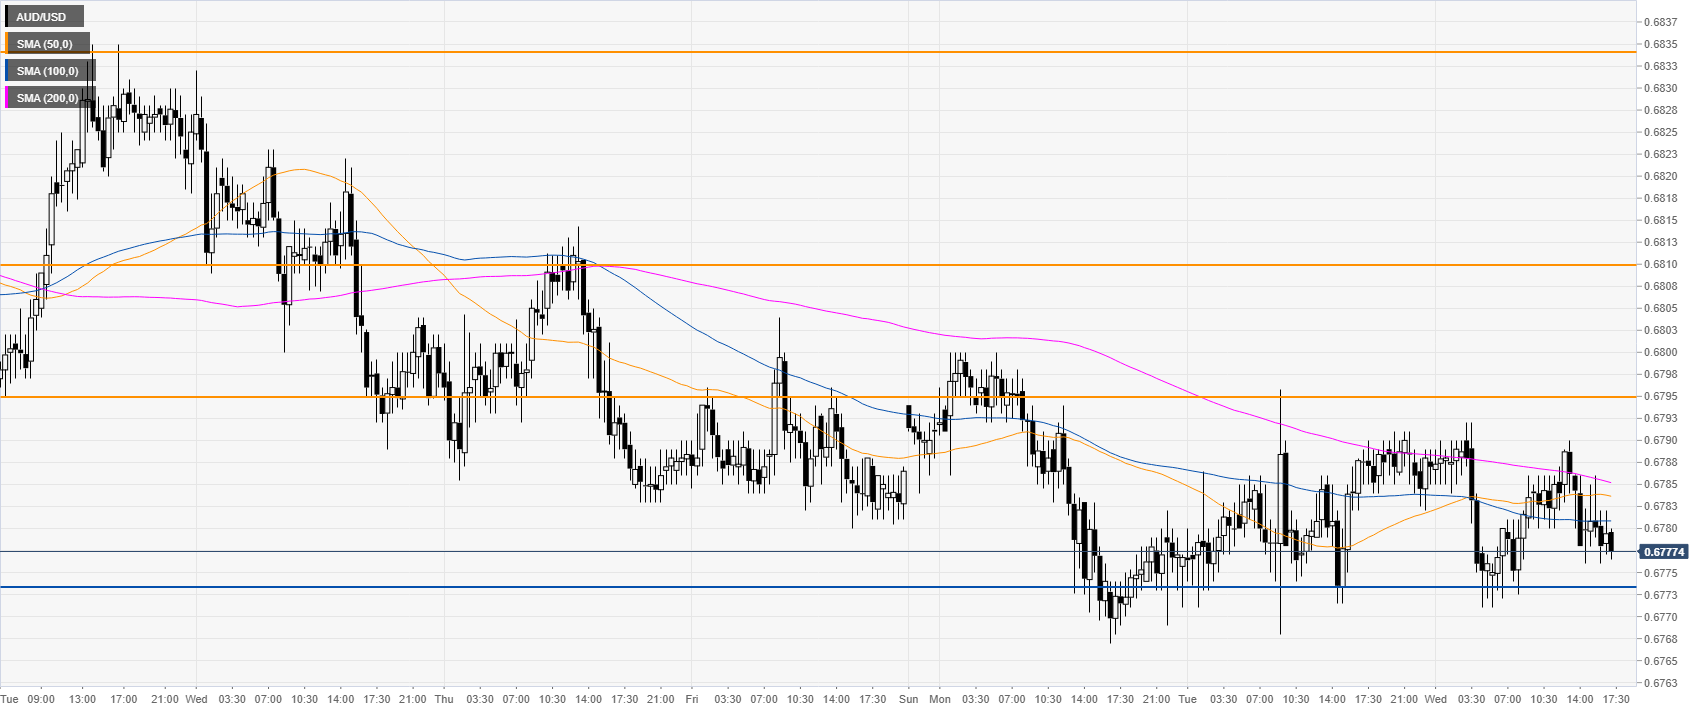
AUD/USD 30-minute chart
AUD/USD is under pressure below the 0.6795 resistance and the main SMAs, suggesting a bearish bias in the short term. Resistance is expected at 0.6795 and the 0.6810 price levels, according to the Technical Confluences Indicator.
Additional key levels
