- The cable is trading near weekly highs as the American session is coming to an end.
- The level to beat for bulls is the 1.2910 level.
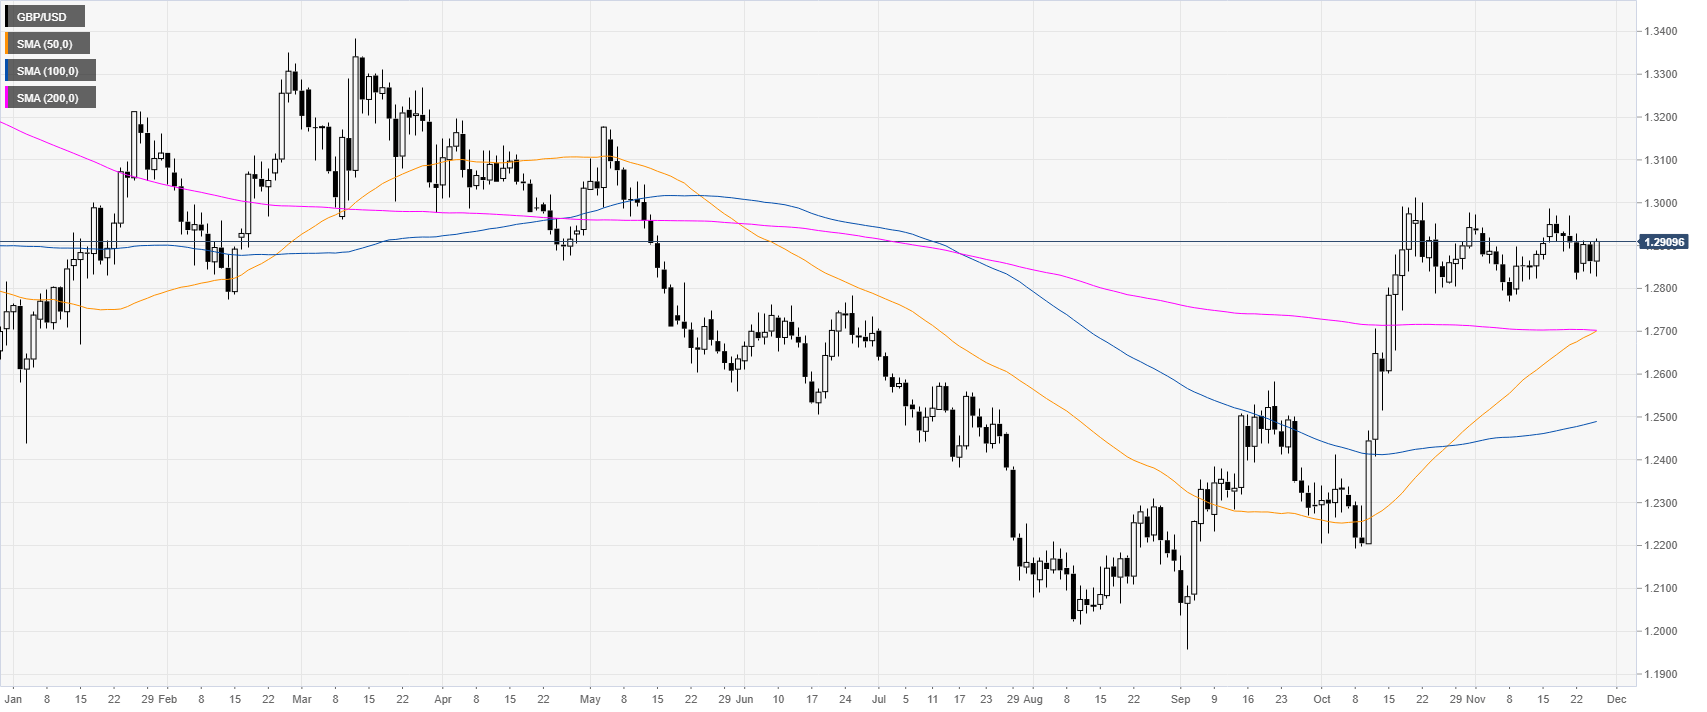
GBP/USD daily chart
GBP/USD is trading just above the 1.2900 handle as the market is consolidating the huge October’s bull run. The market keeps a bullish bias while trading above the main daily simple moving averages (DMAs).
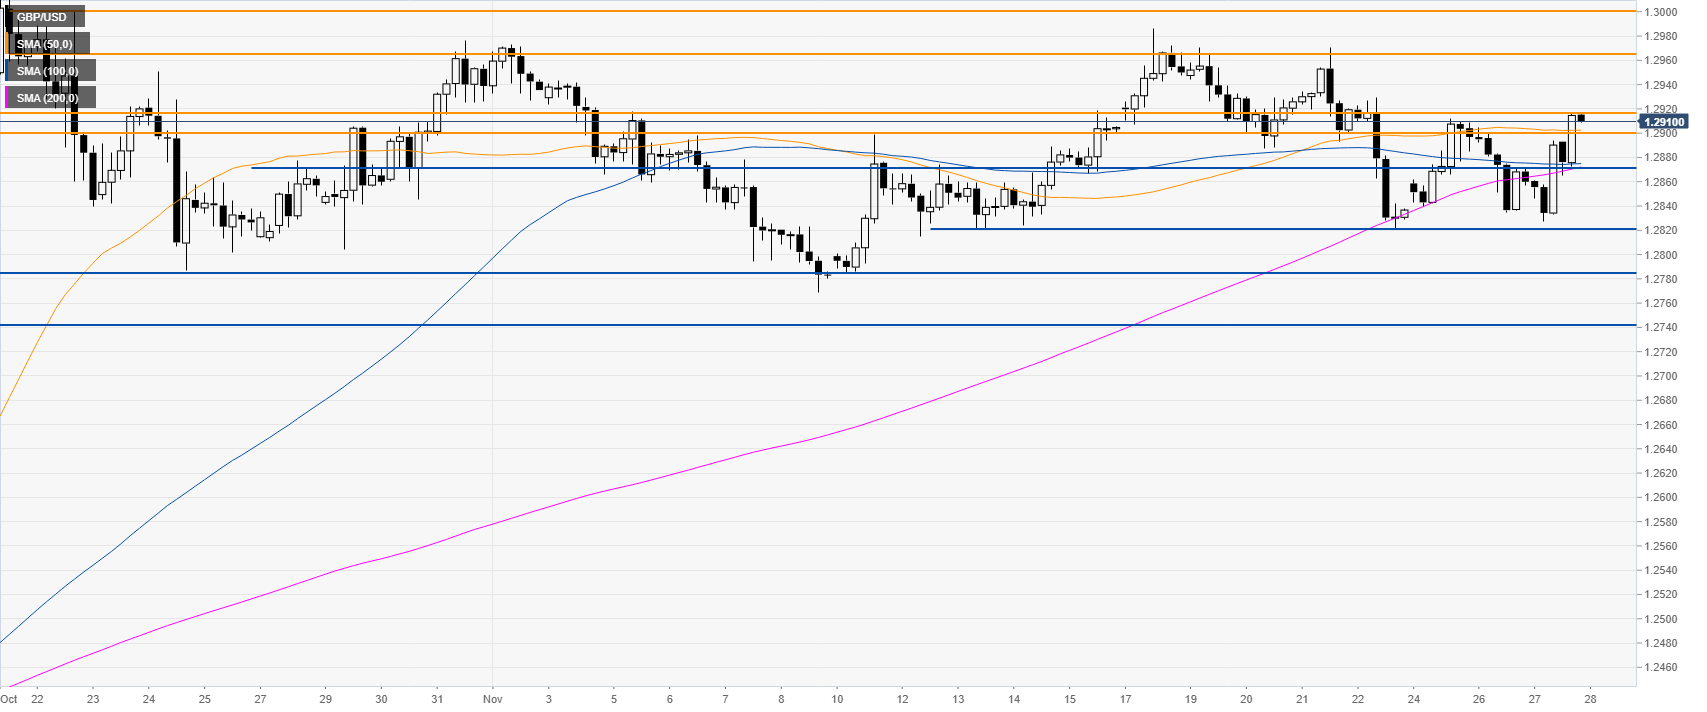
GBP/USD four-hour chart
The market is challenging a critical resistance in the 1.2900/1.2910 price zone. A breach beyond it could lead to further gains, which can extend towards the 1.2965/1.3000 resistance zone.
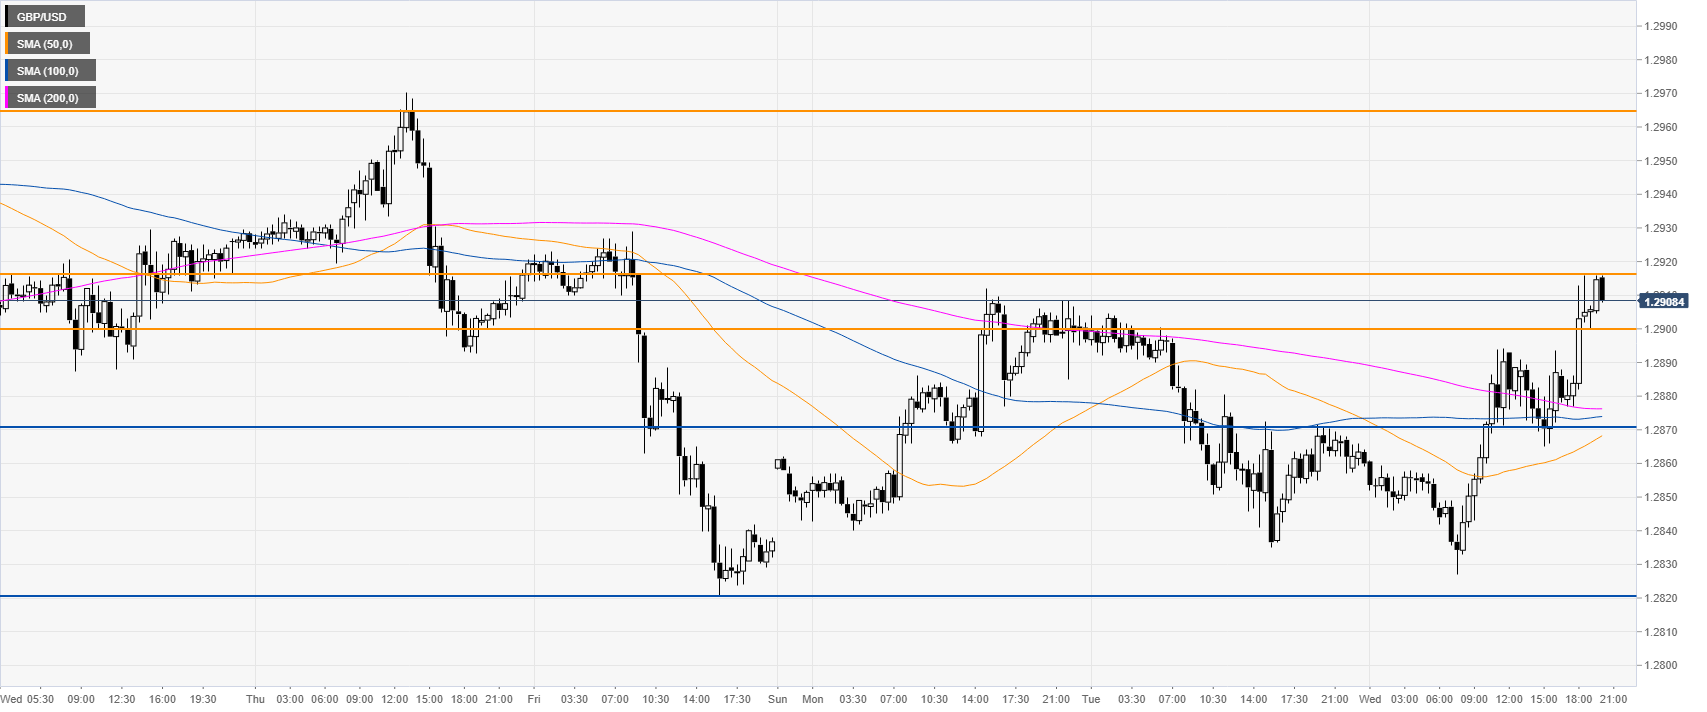
GBP/USD 30-minute chart
Sterling is trading above the main SMAs, suggesting a bullish bias in the short term. Support is expected near the 1.2900 and 1.2870 levels, according to the Technical Confluences Indicator.
Additional key levels
