- The cable is easing from weekly highs trading near the 1.2900 figure.
- The level to beat for bears is the 1.2900 support.
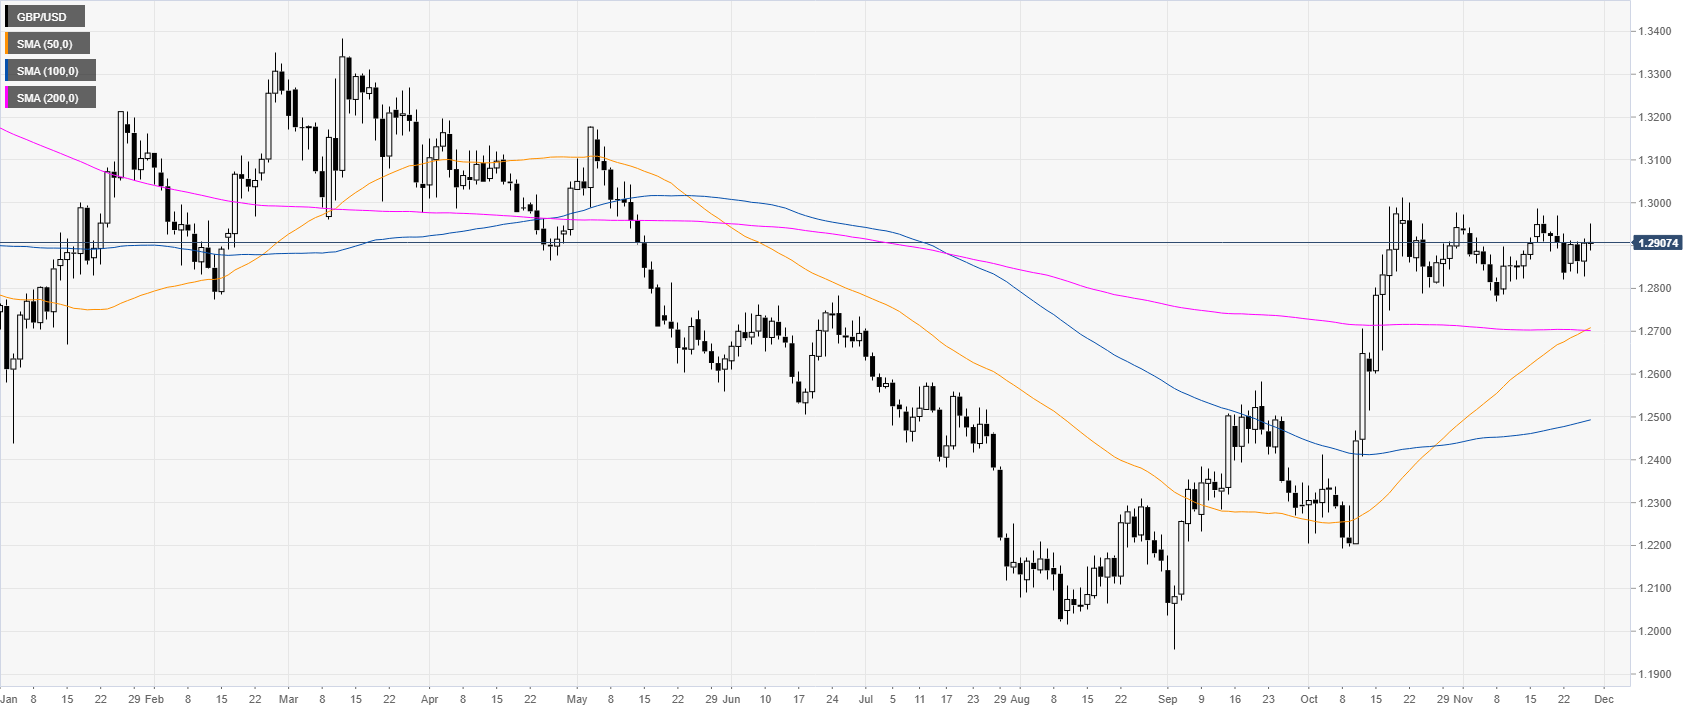
GBP/USD daily chart
GBP/USD is trading near the 1.2900 handle as the market is consolidating the massive October’s rally. The market is maintaining a bullish bias while evolving above the main daily simple moving averages (DMAs).
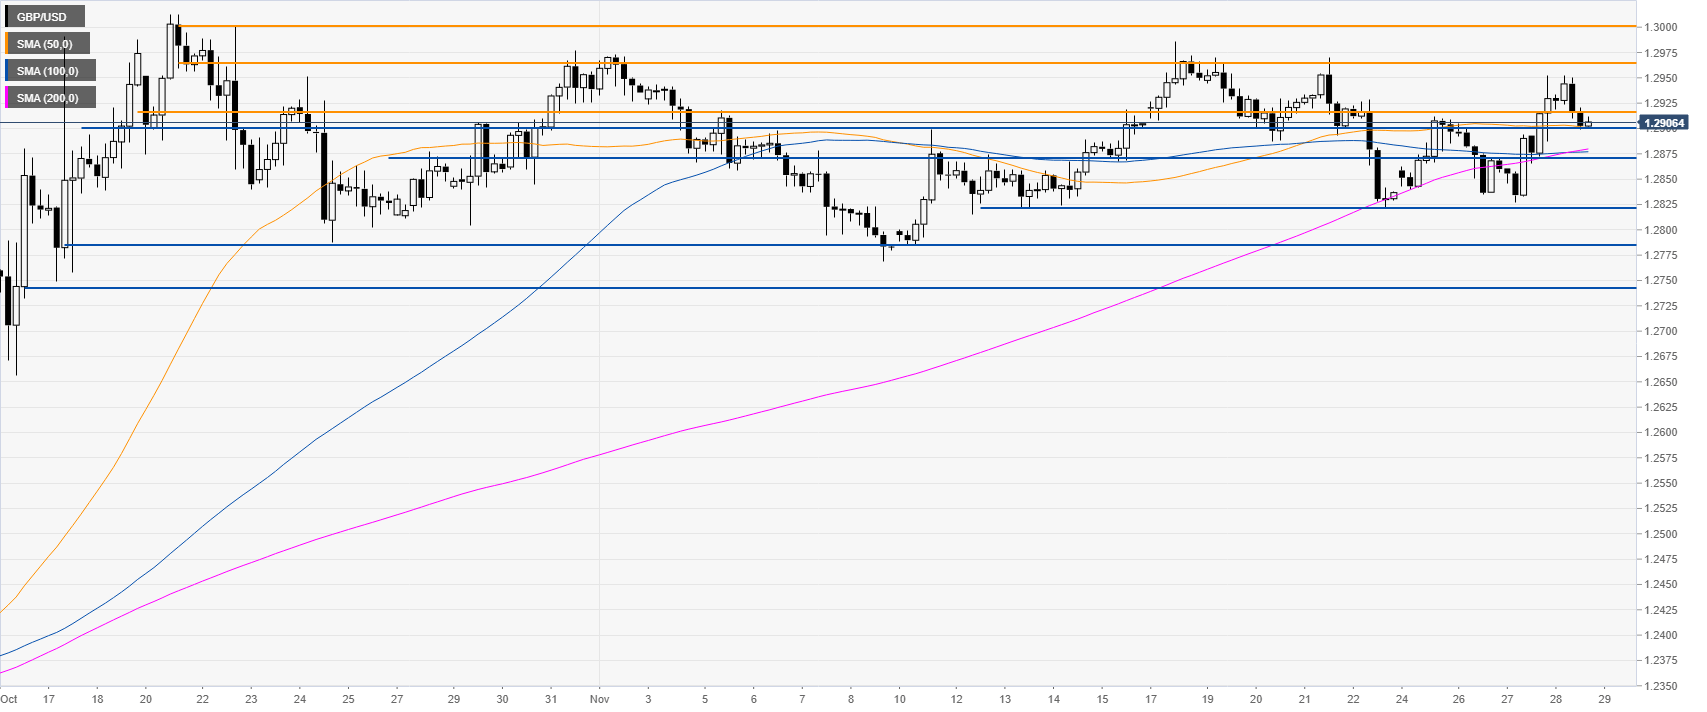
GBP/USD four-hour chart
The market is trading near the 1.2900 handle while above the main SMAs. If sellers break bellow the 1.2900 level, the market could depreciate towards the 1.2870 and 1.2820 levels, according to the Technical Confluences Indicator.
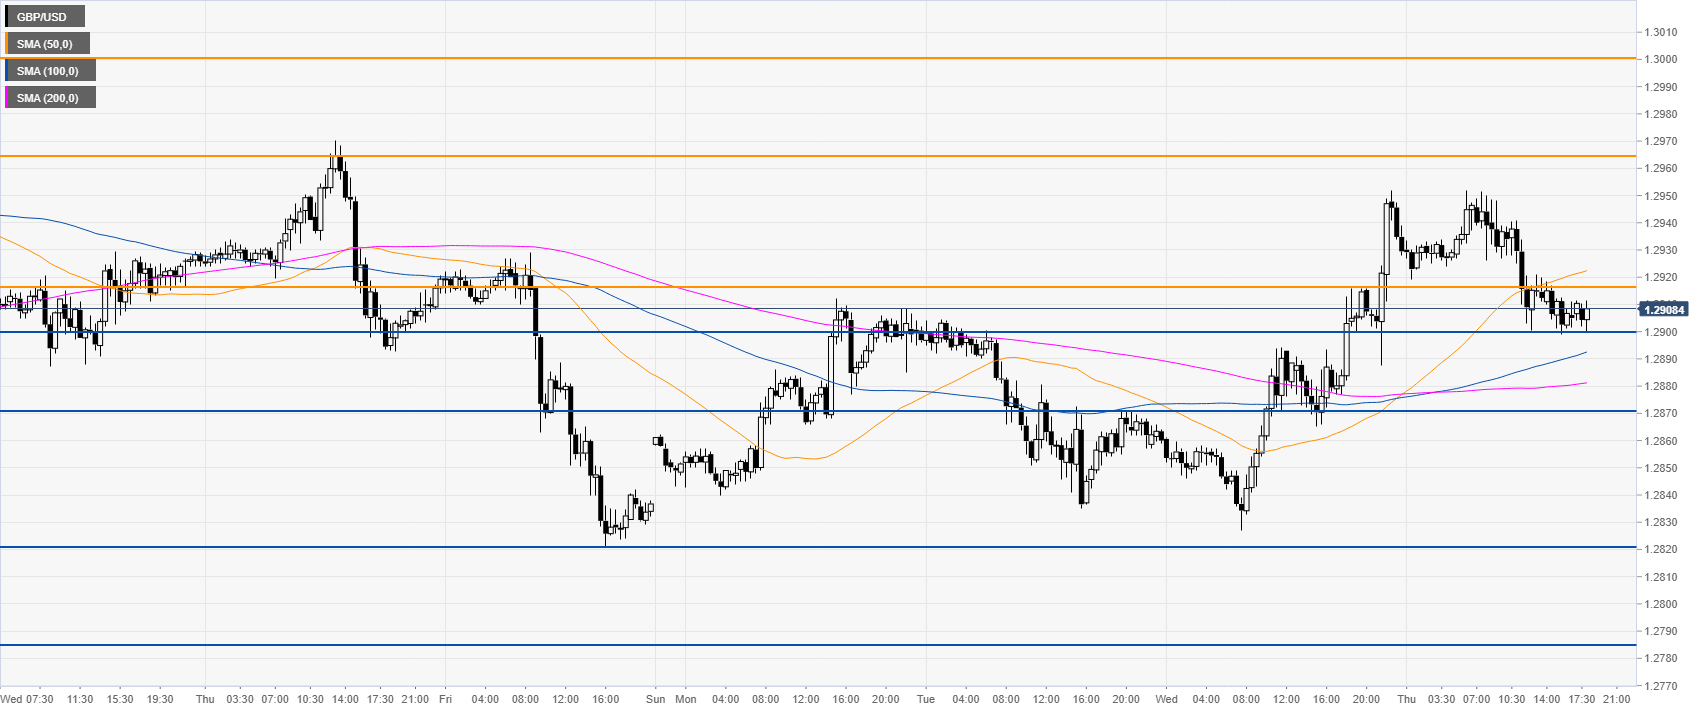
GBP/USD 30-minute chart
Sterling is trading below the 50 SMAs, suggesting a correction down in the short term. Resistance is expected near the 1.2917 and 1.2965 levels, according to the Technical Confluences Indicator.
Additional key levels
