- USD/CAD recovers from one week low.
- Five-month-old falling resistance line, 61.8% Fibonacci retracement on the bull’s radar.
- Sellers look for entry below 50/100-day SMA confluence.
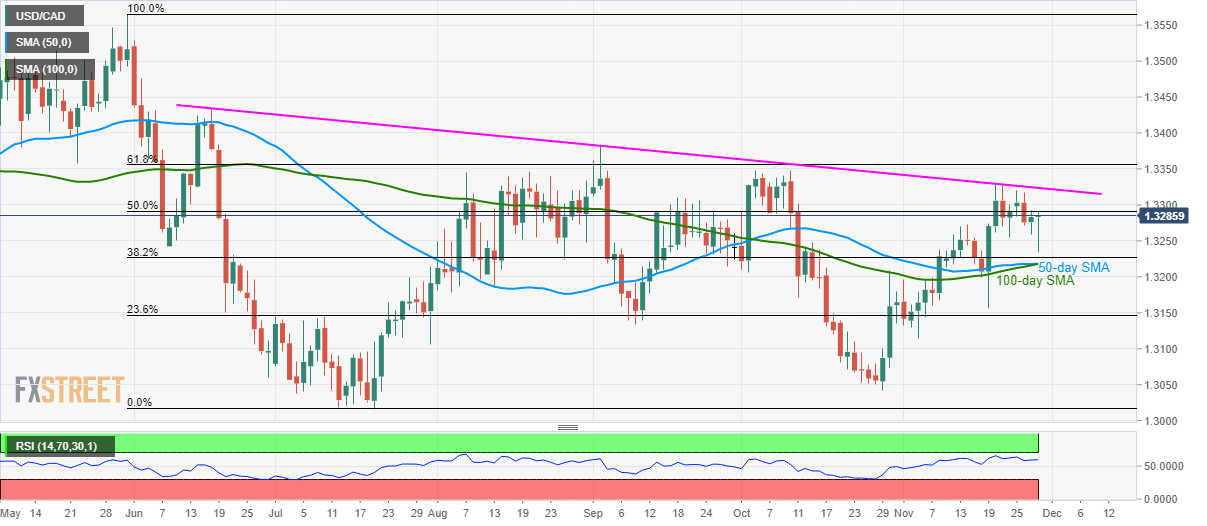
Observing Wednesday’s recovery, USD/CAD confronts 50% Fibonacci retracement of May-July fall while taking the bids to 1.3285 during the initial trading session on Thursday.
The quote needs to provide a daily closing beyond 1.3292 in order to confront a downward sloping trend line since June 19, near 1.3325. Though, pair’s further upside will be challenged by 61.8% Fibonacci retracement, at 1.3356.
Alternatively, 50-day and 100-day Simple Moving Average (SMA) around 1.3220/15 can keep sellers away.
However, the price-drop below 1.3215 on a daily closing basis might not refrain from challenging 23.6% Fibonacci retracement level around 1.3150.
USD/CAD daily chart
Trend: Pullback expected
