- USD/JPY is trading at levels not seen since late May 2019.
- Resistance is seen at the 109.92/110.00 price zone.
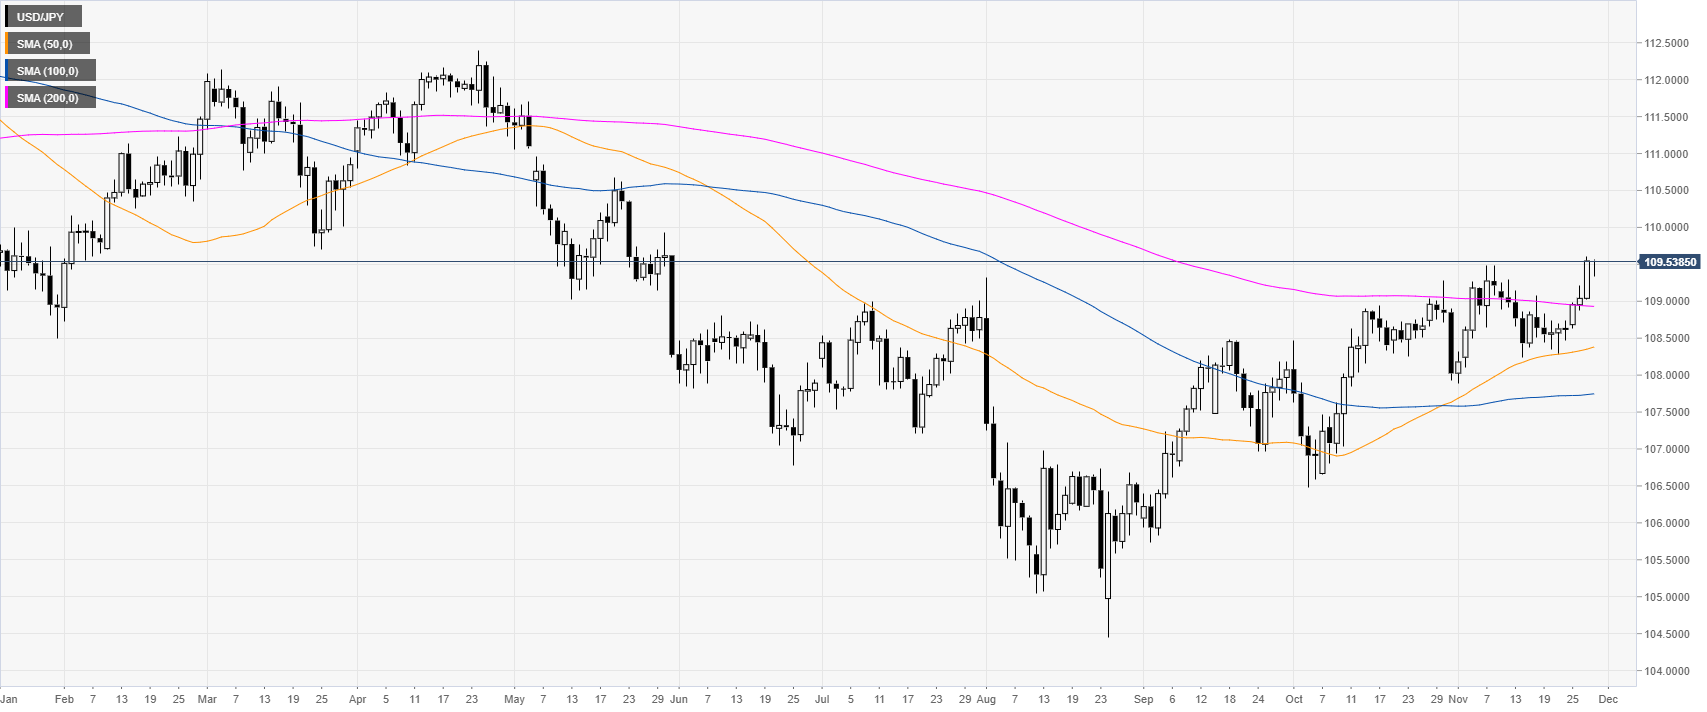
USD/JPY daily chart
USD/JPY is trading above the 109.00 handle and the 200-day simple moving average (DMA) on the daily chart. The market is trading at levels not seen since late 2019.
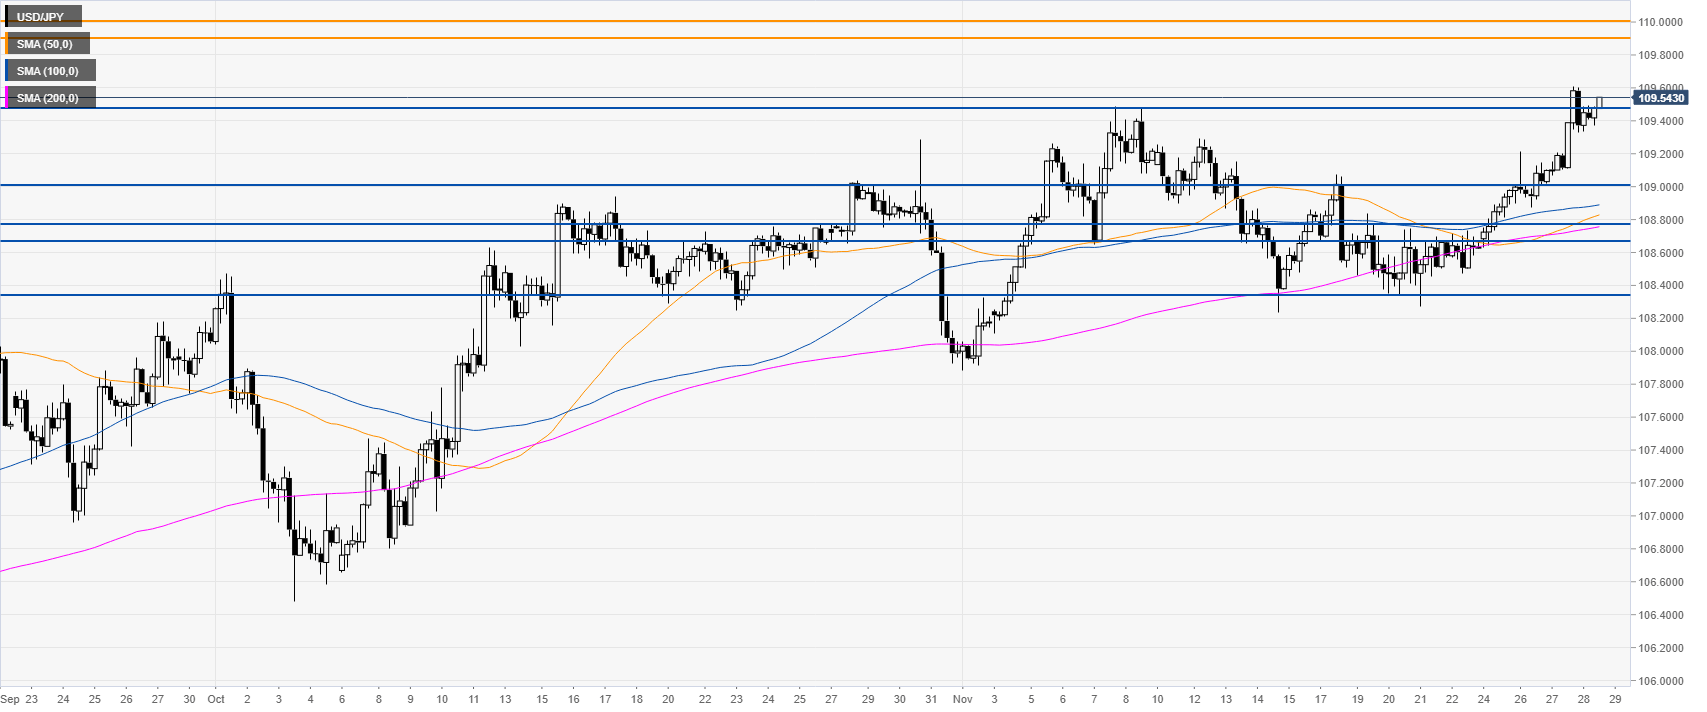
USD/JPY four-hour chart
The market is trending up as the bulls broke above the 109.46 level. As the market is gaining momentum, the market might be headed towards the 109.92/110.00 resistance zone, according to the Technical Confluences Indicator.
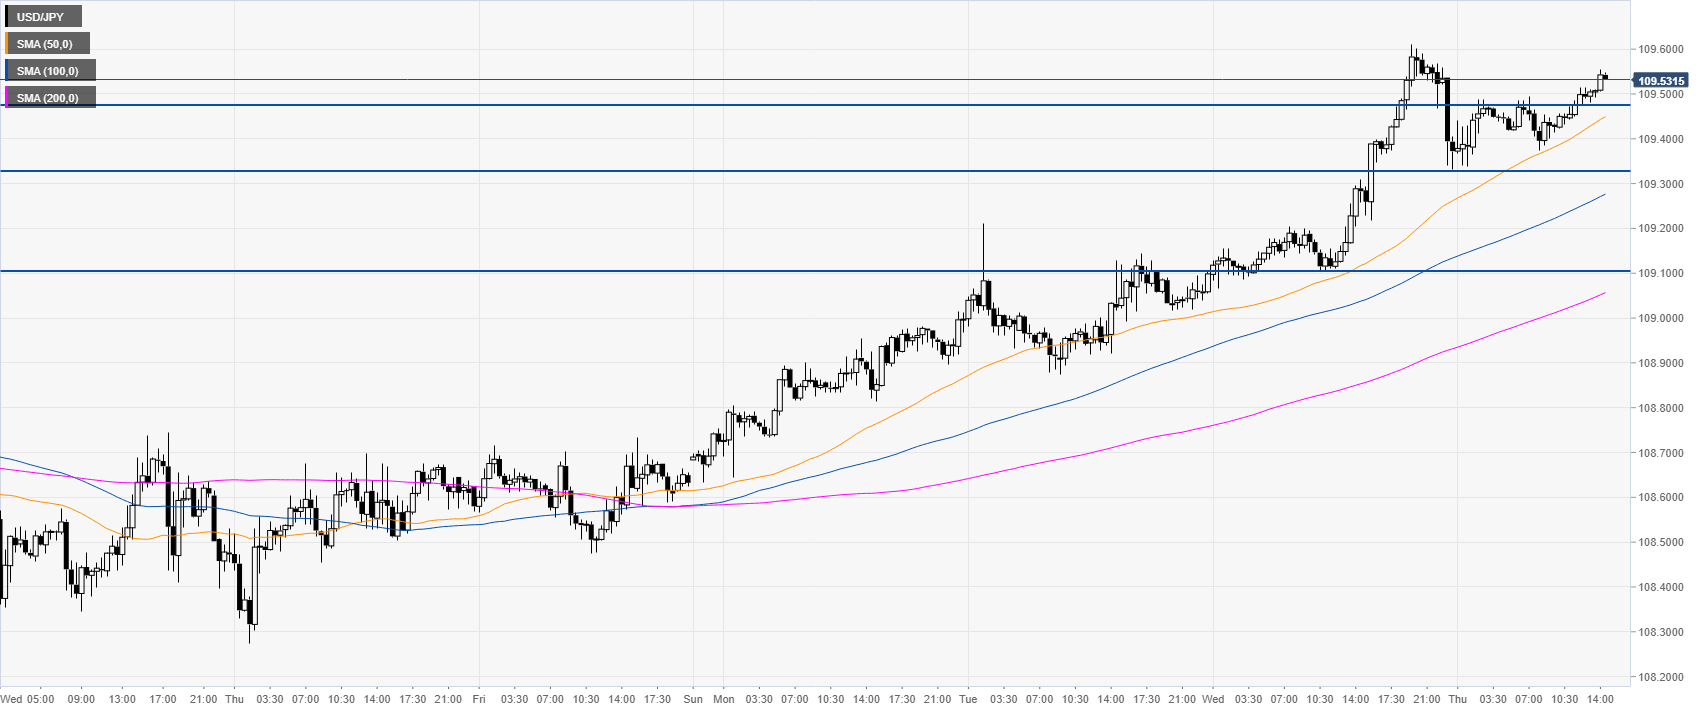
USD/JPY 30-minute chart
USD/JPY is climbing above the main SMAs on the 30-minute chart suggesting a bullish bias in the near term. Support is seen at the 109.47, 109.33 and 109.10 price levels, according to the Technical Confluences Indicator.
Additional key levels
