- The cable is ending November virtually unchanged above the 1.2900 handle.
- The level to beat for bulls is the 1.2965/1.3000 resistance zone.
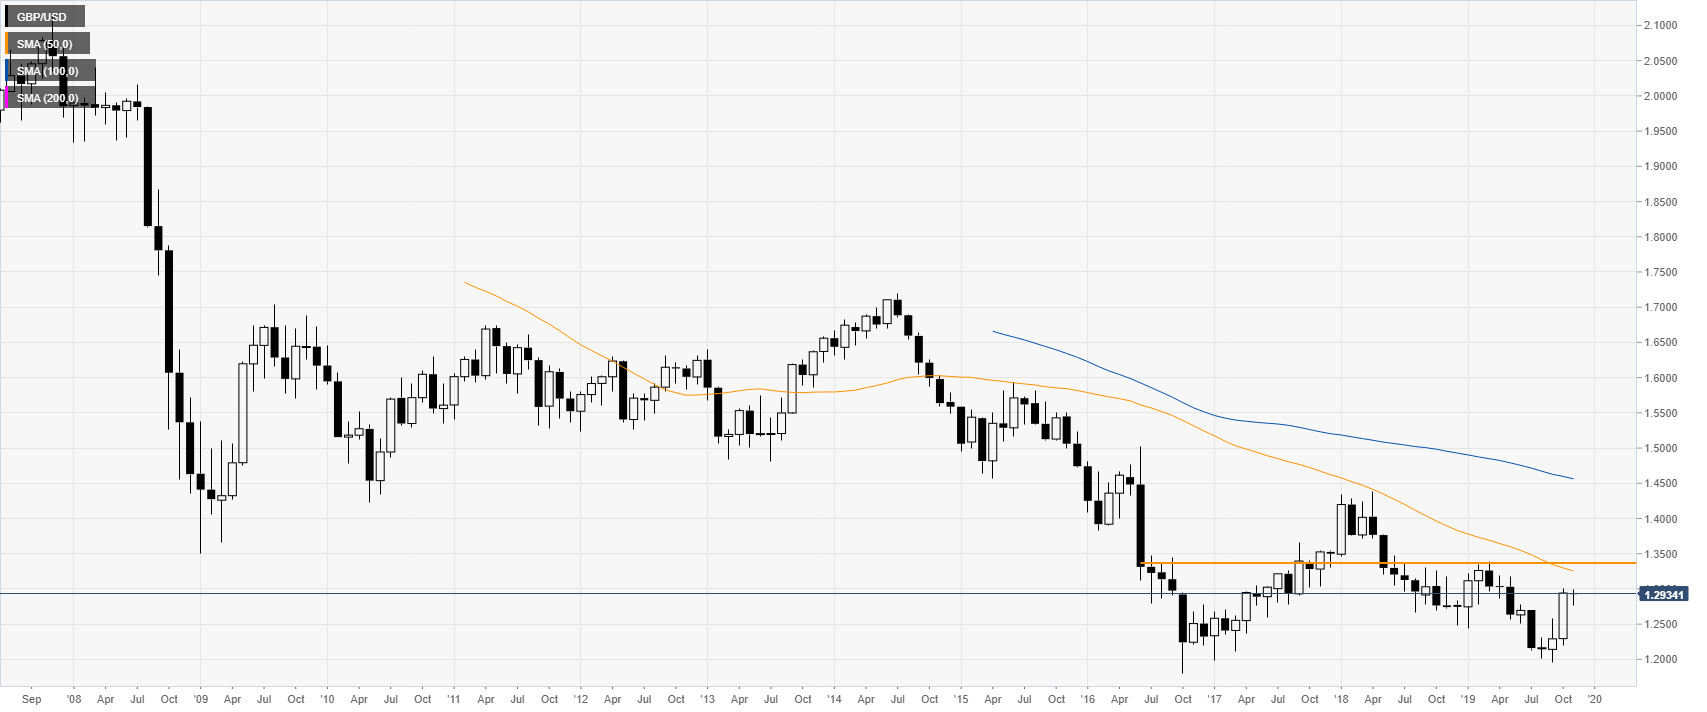
GBP/USD monthly chart
The market is ending the month virtually unchanged in November while consolidating near the October highs. The key resistance to reach for bulls on the way up is likely the 1.3400 handle.
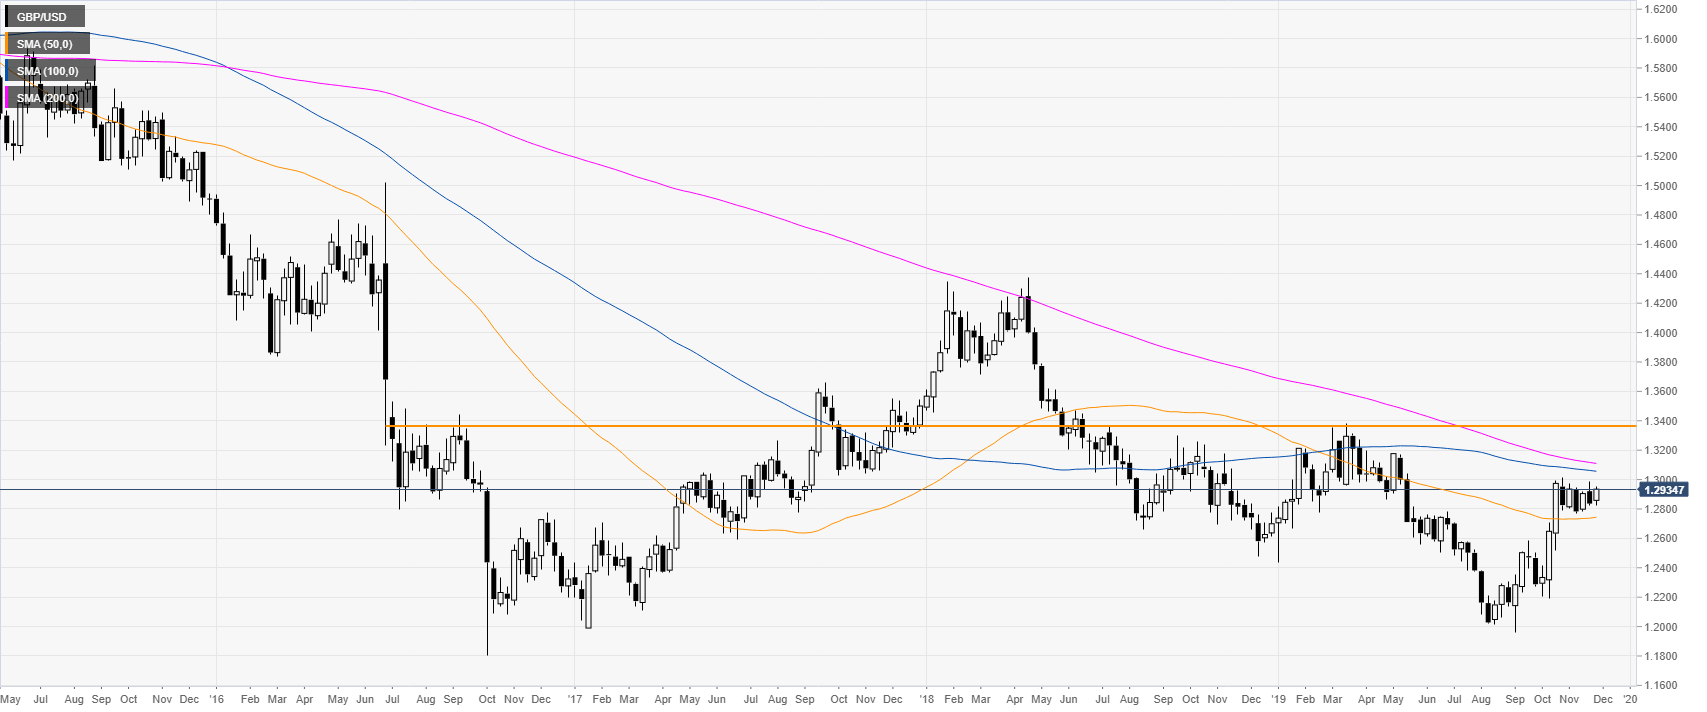
GBP/USD weekly chart
The market has been consolidating for the sixth consecutive week while trading above the 1.2800 handle and the 50-week SMA.
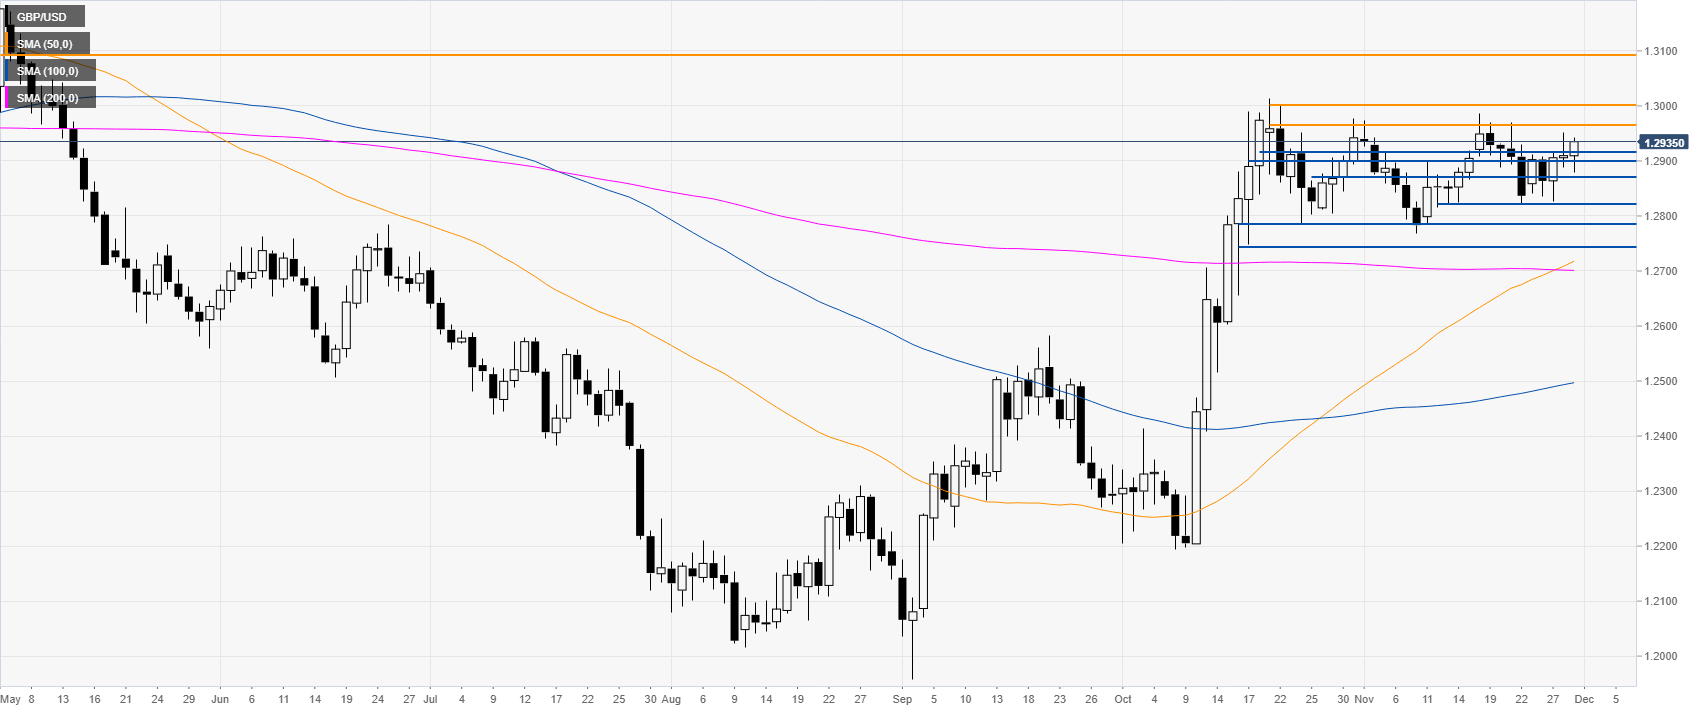
GBP/USD daily chart
The market is trading above the 1.2900 handle while above the main SMAs. The level to beat for bulls is the 1.2965/1.3000 resistance zone. A break above it can lead to further gains towards the 1.3100 handle, according to the Technical Confluences Indicator.
Additional key levels
