- The yellow metal remains under selling pressure on the last day of the month.
- The 1445 level remains on the sellers’ radar.
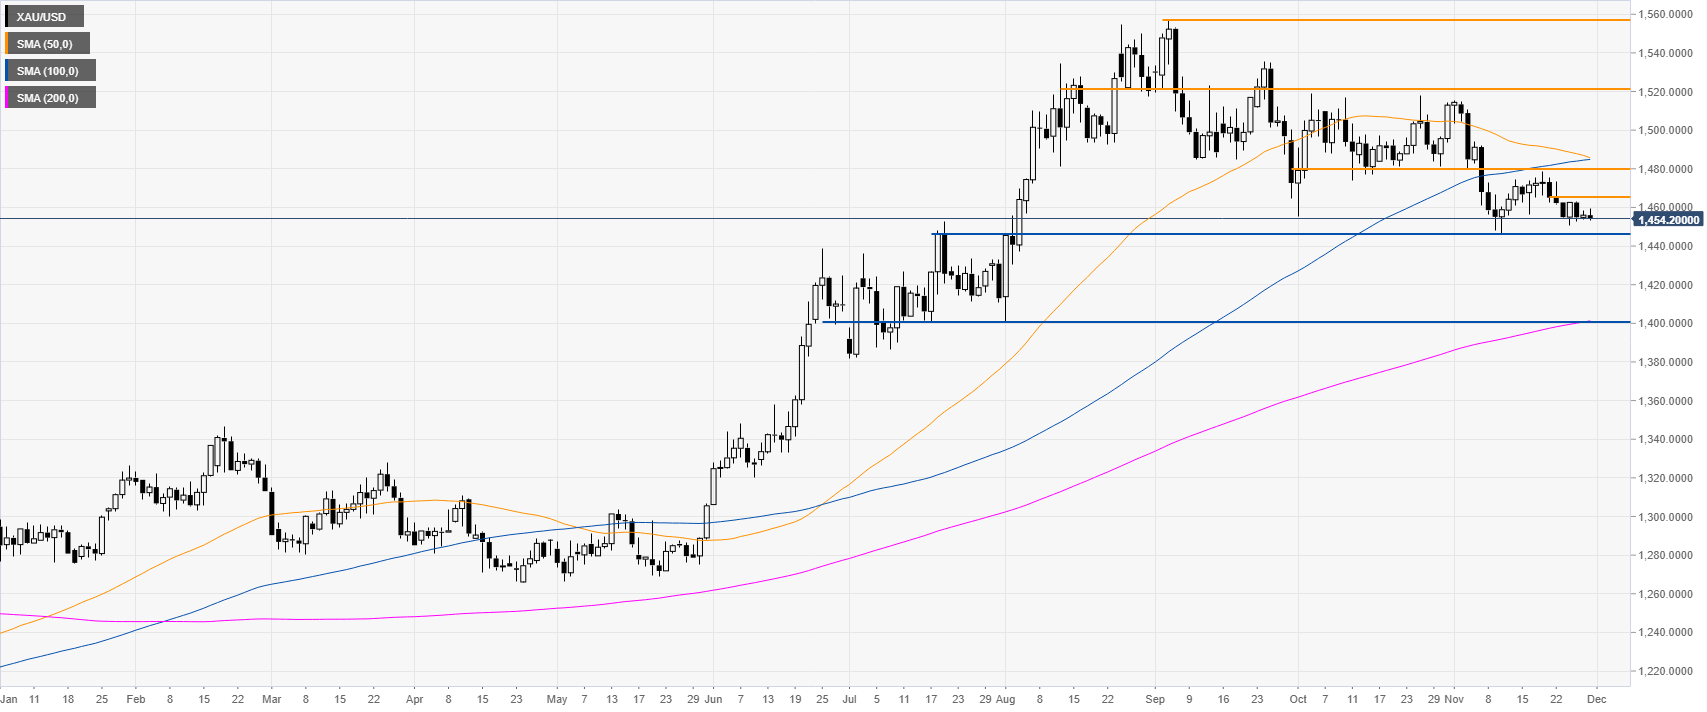
Gold daily chart
On the daily chart, gold remains under selling pressure near the November lows while trading below the 1465 resistance level and the 50/100 SMAs. However, the bears need a break below the 1445 swing low. If so, the market could depreciate further towards the 1400 figure near the 200-day SMA.
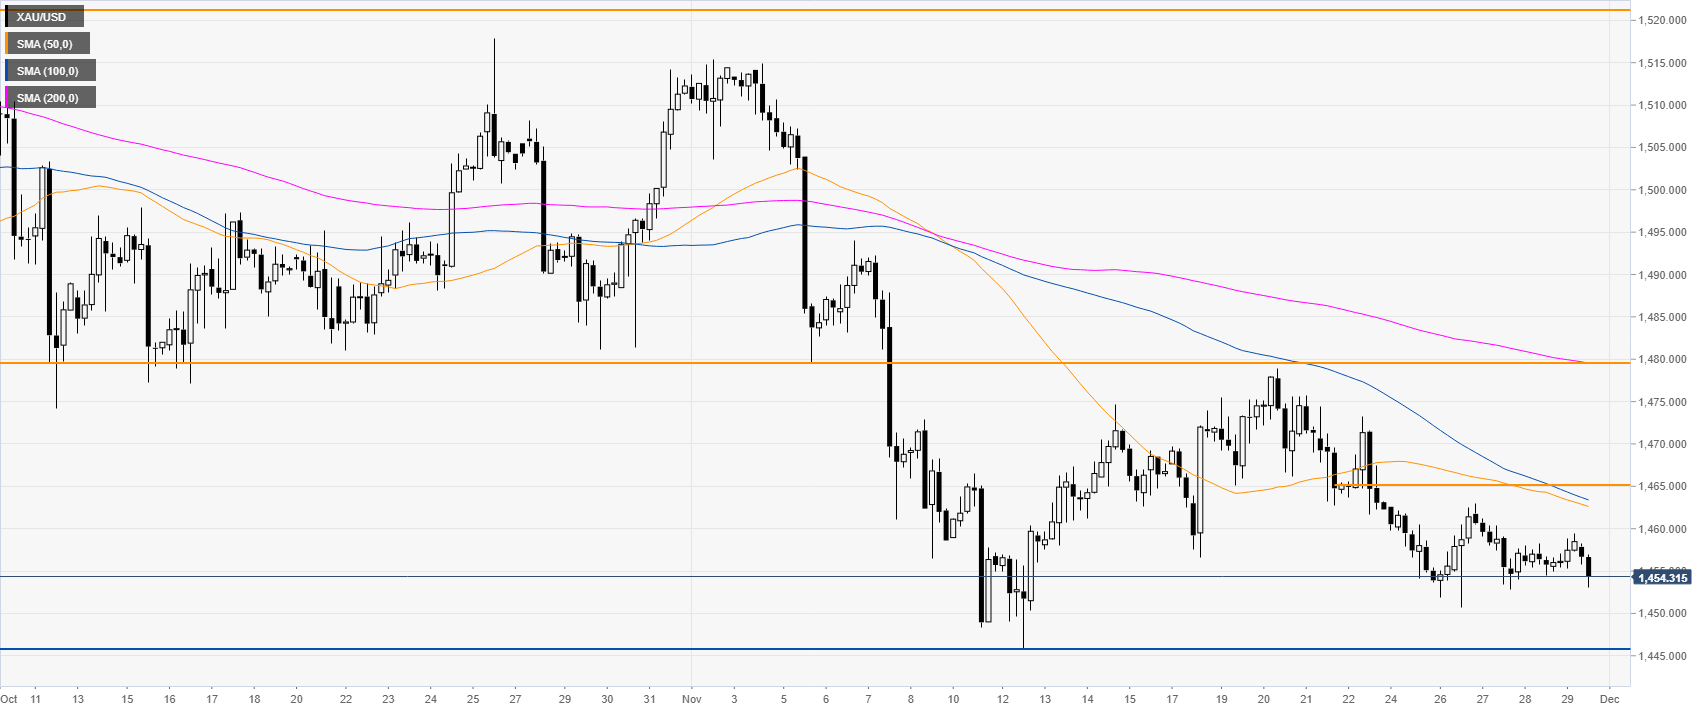
Gold four-hour chart
The market is slowly drifting down while trading below the main SMAs. As XAU/USD remains soft, the 1445 level remains on the sellers’ radar in the medium term. Immediate resistance can be seen near the 1465 and 1480 levels.
Additional key levels
