- DXY retreats after hitting fresh November highs.
- A correction seems underway. Support is seen at the 98.20 level and 98.00 handle.
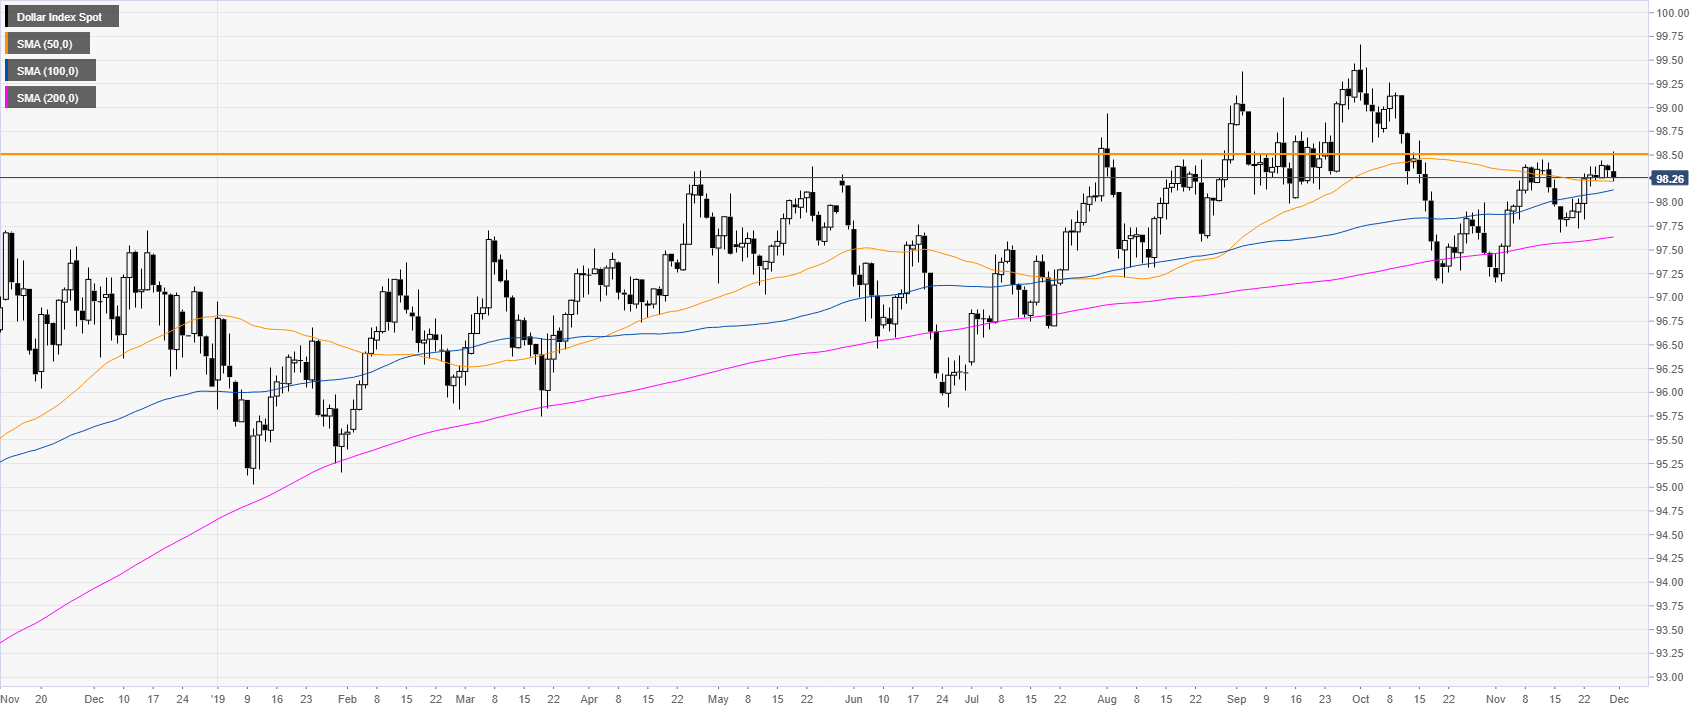
DXY daily chart
DXY (US Dollar Index) is trading in a bull trend above the main daily simple moving averages (DMAs). However, this Friday, the greenback had a failed breakout above the 98.50 resistance.
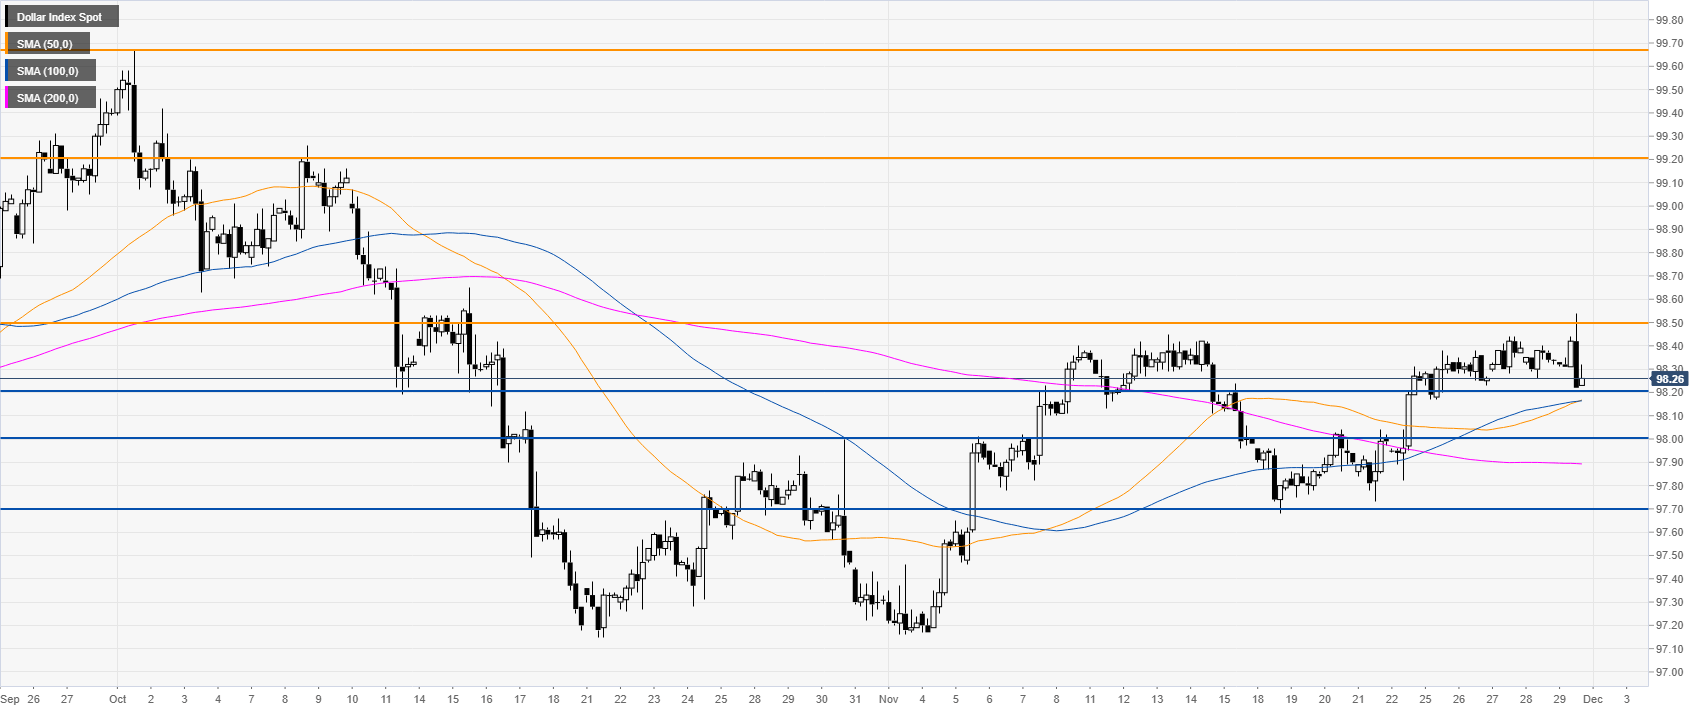
DXY four-hour chart
DXY is trending up above the main SMAs on the four-hour chart. However, the market rejected a critical resistance at the 98.50 level after hitting fresh November highs. To continue the uptrend, bulls must have a daily close above the 98.50 level to reach 99.20 level and the 99.67 level (2019 high).
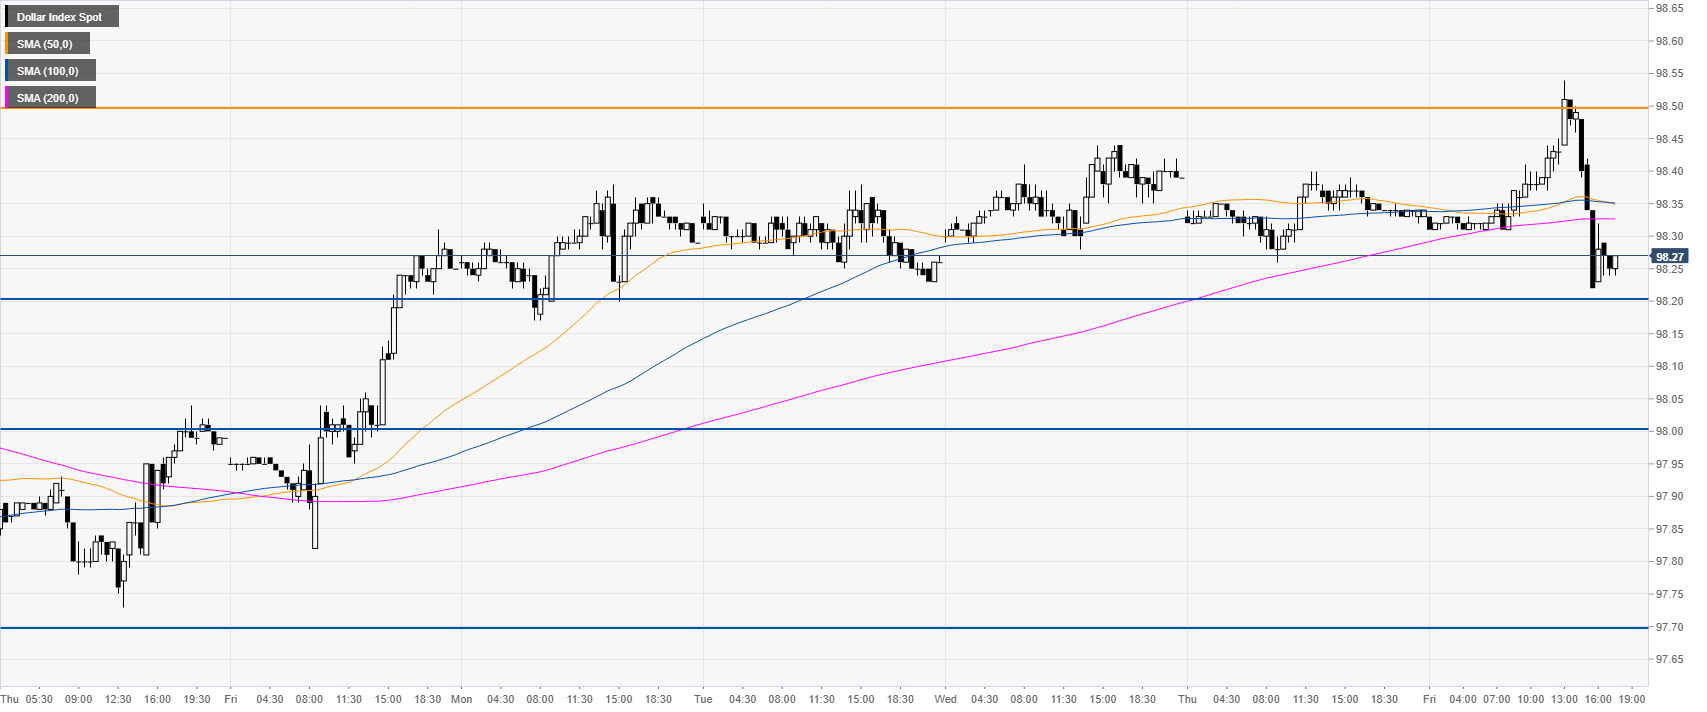
DXY 30-minute chart
The greenback dropped below its main SMAs, suggesting a bearish momentum in the near term. A break below the 98.20 level can expose the 98.00 handle.
Additional key levels
