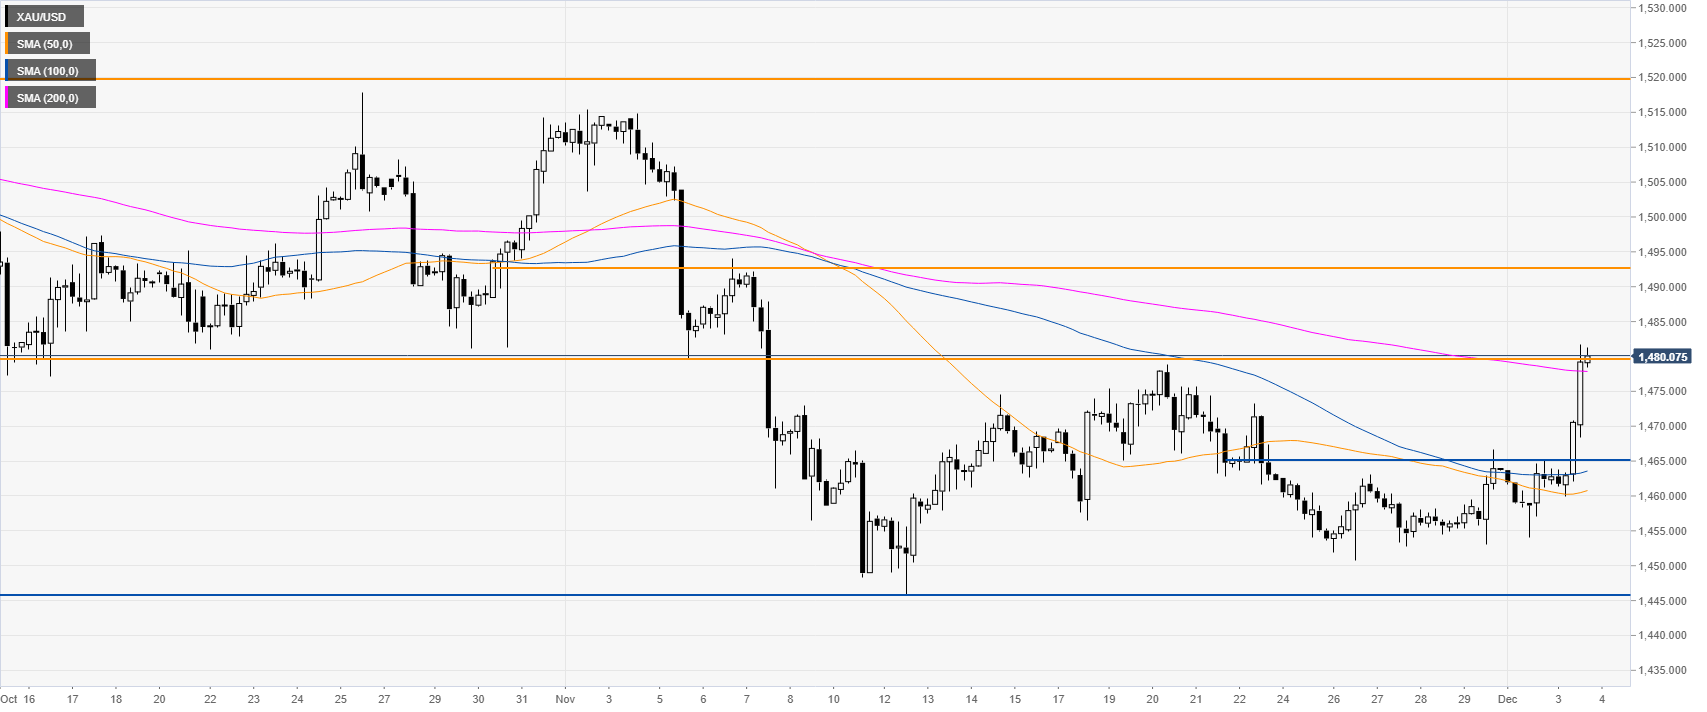
- The yellow metal is trading at its highest in the last three weeks.
- The level to beat for bulls is the 1480 resistance.
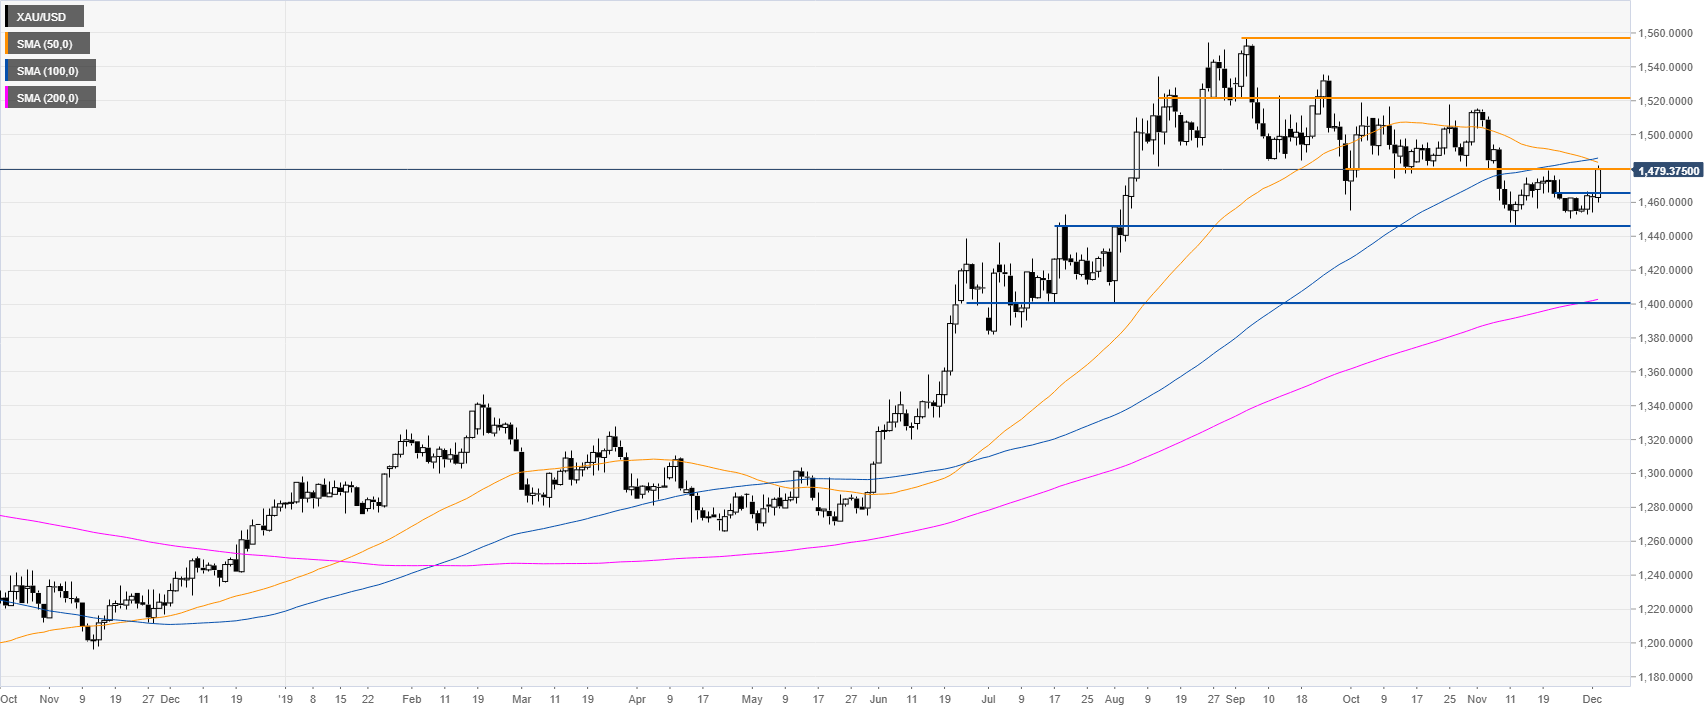
Gold daily chart
Gold is reversing up from the November lows while breaking the 1465 resistance level. It is now nearing the 50 and 100-day simple moving averages (SMAs).
Gold four-hour chart
The metal is challenging the 1480 resistance near the 200 SMA. A break above this level can lead to further gains towards 1493 and 1520 if the bulls gather enough steam. Support is seen at the 1465 level.
Additional key levels
