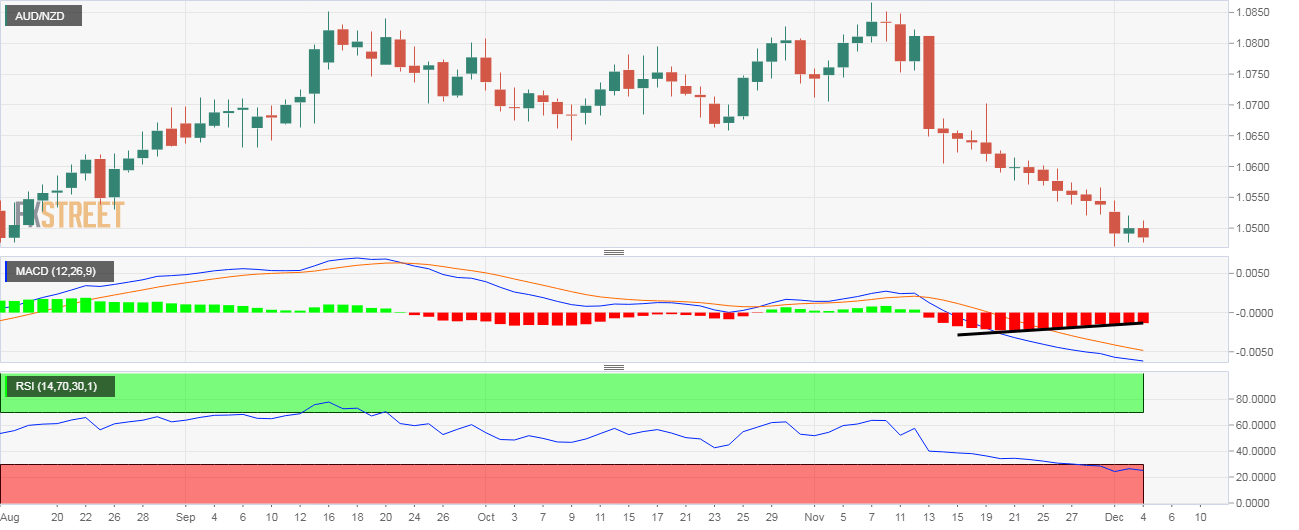
- AUD/NZD’s daily chart indicators are reporting oversold conditions.
- A consolidation or a minor bounce to the stiff 50-hour average resistance could be in the offing.
AUD/NZD is currently trading at1.0488, representing a 0.12% drop on the day, having hit a session low of 1.0475 soon before press time.
The pair is flashing red as Australia’s gross domestic product (GDP) growth slowed to 0.4% quarter-on-quarter in the September quarter from the previous quarter’s 0.5% reading. The GDP figure has confirmed that the Reserve Bank of Australia will have to provide extra stimulus in 2020.
Therefore, the path of least resistance for the AUD is to the downside.
That said, the AUD/NZD pair may witness consolidation or minor bounce before the deeper drop, as the widely-tracked MACD histogram has printed shallow bars below the zero line over the last two weeks, indicating seller exhaustion.
Further, the 14-day relative strength index is also reporting oversold conditions with a below-30 print.
That said, the immediate bearish case would weaken only above the 100-hour average, currently 1.0518. That average has reversed gains consistently since Nov. 12.
Daily chart
Trend: Bear exhaustion
Technical levels
