- DXY is under heavy pressure below the 97.70 level and the 200 DMA.
- The 97.20 support level is on the bears’ radar in the medium term.
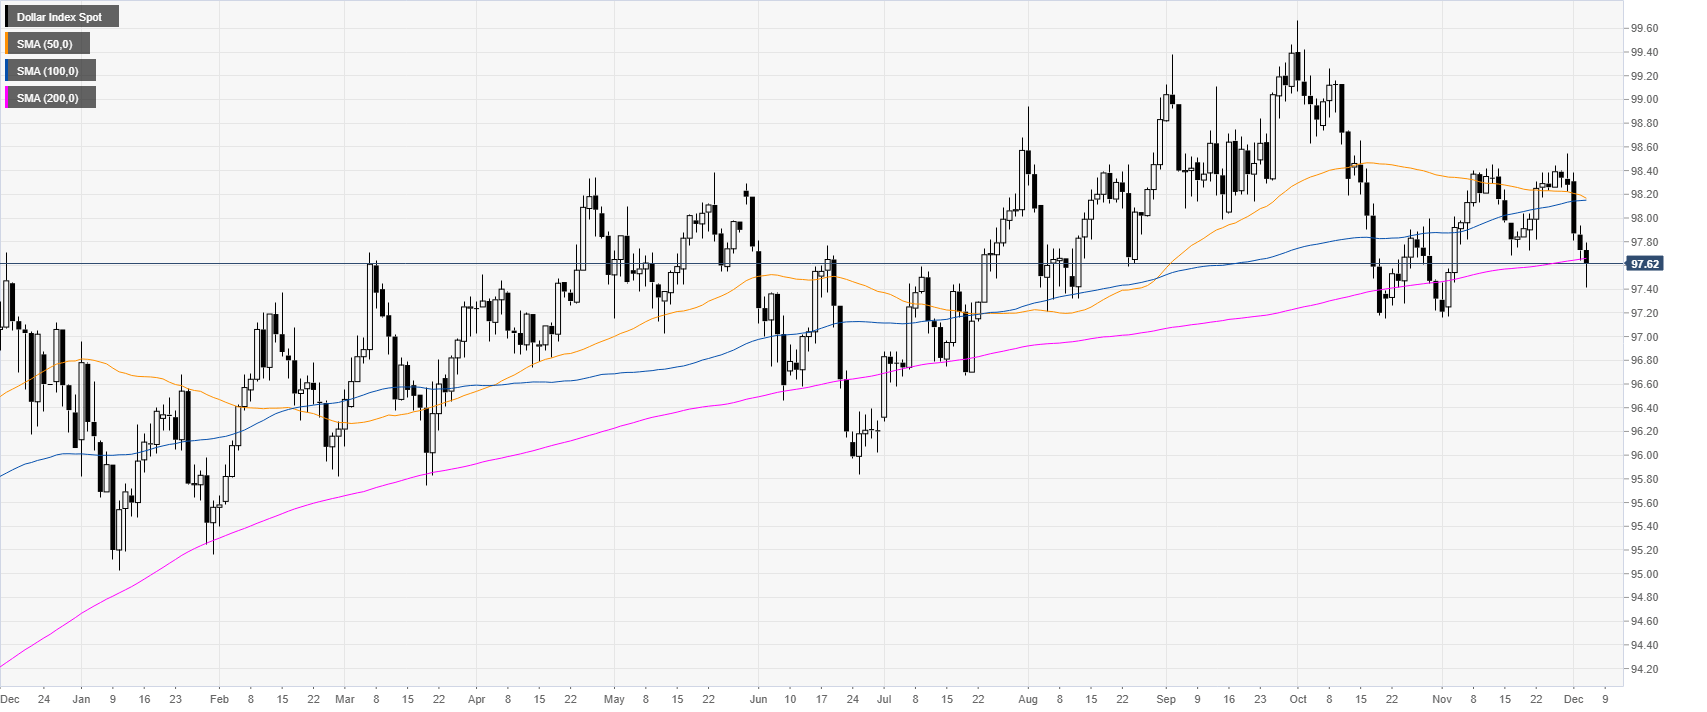
DXY daily chart
DXY (US Dollar Index) is trading in a bull trend as it is challenging the 200-day simple moving average (DMA). However, DXY is becoming increasingly weak and at risk of a selloff.
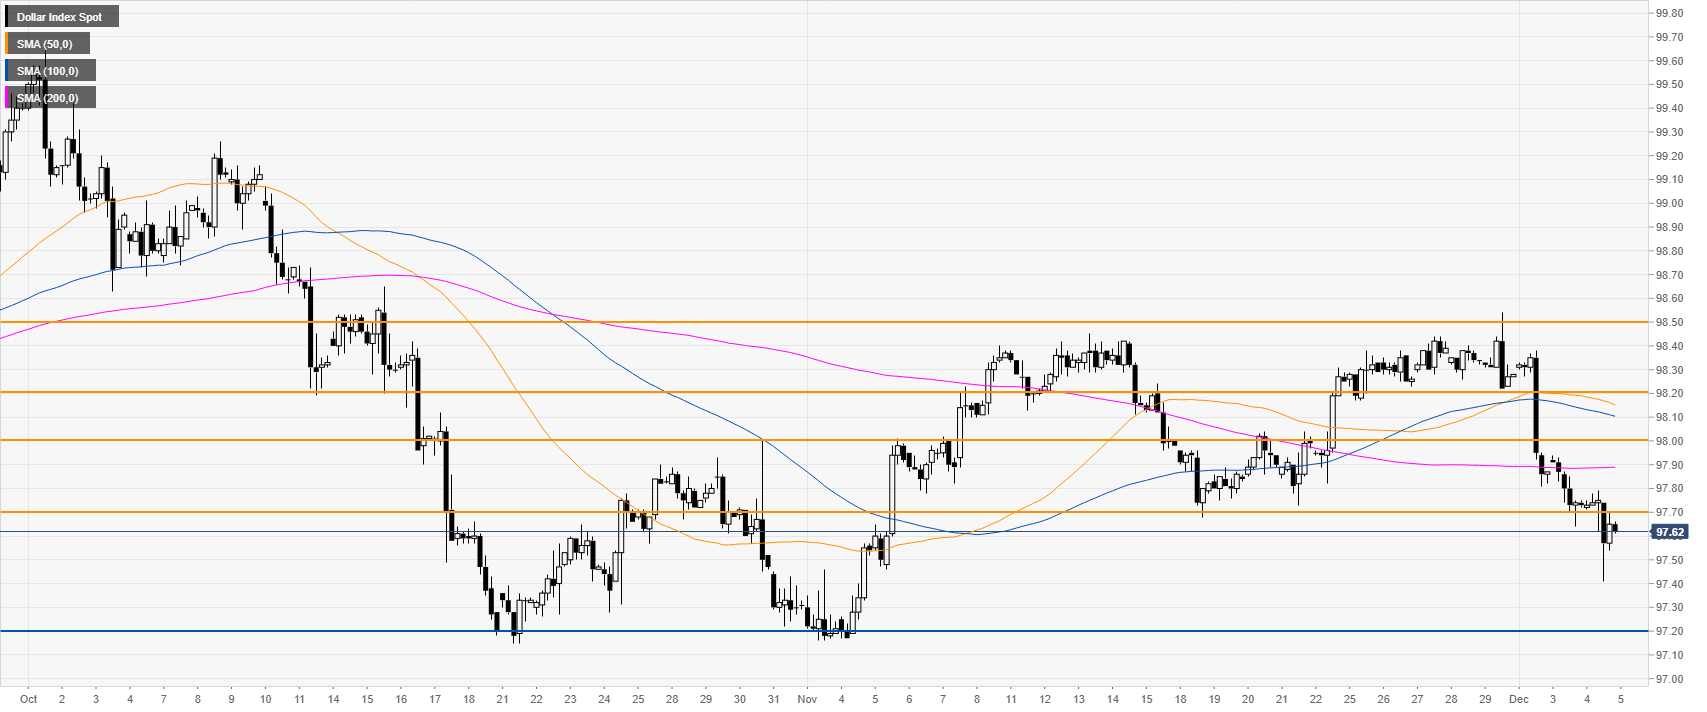
DXY four-hour chart
DXY broke below a critical support at the 97.70 level while trading below the main SMAs. At this stage, it seems that it is too late for bulls to intervene as a decline towards the 97.20 support level seems virtually inevitable.
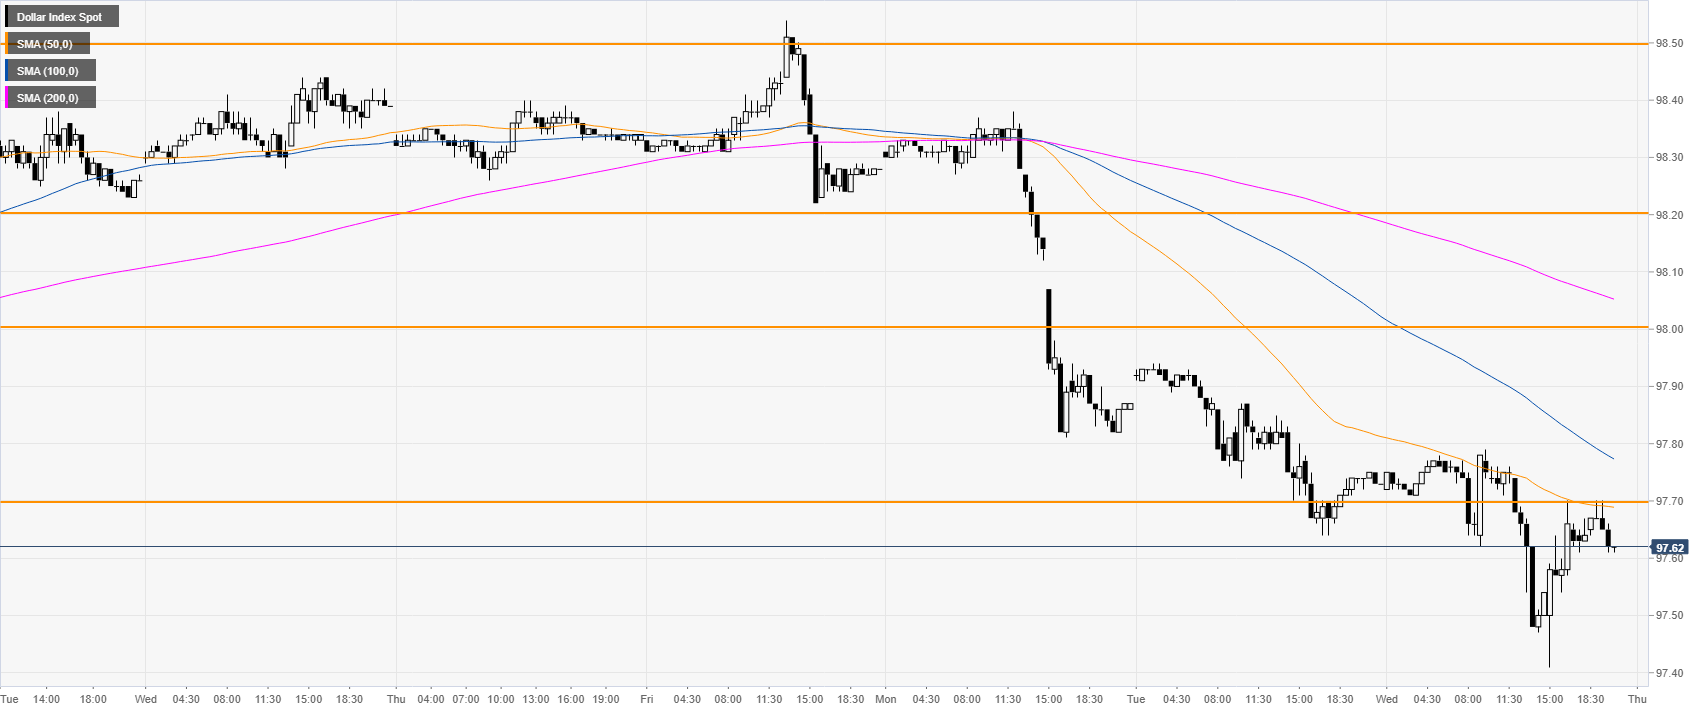
DXY 30-minute chart
The greenback is under pressure below its main SMAs. Resistance can be seen near the 97.70 and 98.00 levels.
Additional key levels
