- GBP/USD nears the seven month high.
- An upward sloping trend line since late-June, overbought conditions of RSI highlight October top as nearby support.
- Bulls can target May high, yearly top during the further rise.
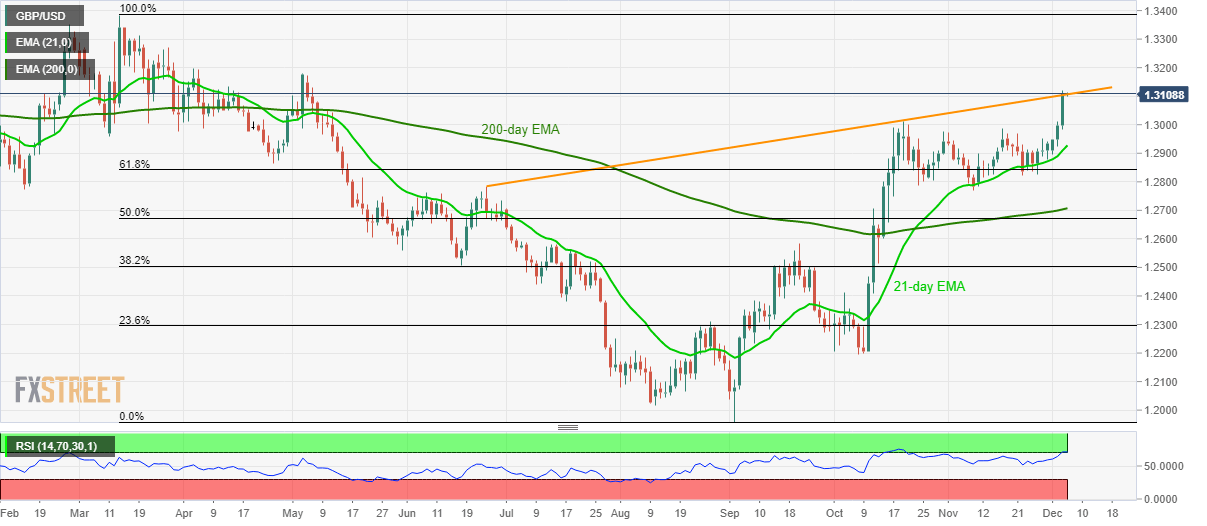
GBP/USD seesaws around 1.3100 during Thursday’s Asian session. The pair clings to a multi-month-old rising resistance line amid overbought conditions of 14-day Relative Strength Index (RSI).
Sellers look for entry below October month high, at 1.3013, to take aim at November top surrounding 1.2985. Though, 21-day Exponential Moving Average (EMA) could restrict the pair’s further declines near 1.2930.
Should prices decline below 21-day EMA, 61.8% Fibonacci retracement of March-September fall, at 1.2840, holds the key for the pair’s further south-run towards the previous month low near 1.2770 and 200-day EMA close to 1.2707.
On the contrary, bulls will wait for a successful break of Wednesday’s high of 1.3121 to target the May month top surrounding 1.3180.
Moreover, the pair’s extended rise past-1.3180 enables it to challenge 1.3270 and the yearly high around 1.3385.
GBP/USD daily chart
Trend: Pullback expected
