- WTI pulls back from one week high.
- An upside break could recall late-September tops.
- 23.6% Fibonacci retracement seems to be the next on sellers radar.
WTI declines $58.30 while heading into the European open on Thursday. With this, the black gold repeats the pattern of pulling back from $58.70/80 as marked in the previous month.
As a result, sellers can take aim at 23.6% Fibonacci retracement level of October-November rise, at $57.55, ahead of looking at the month-start top near $56.70.
If prices keep it below $56.70, 61.8% Fibonacci retracement and November 20 low, close to $55.70 and $54.90 respectively, can please the bears.
Alternatively, an upside clearance of $58.80 will need validation from $59.00 while challenging September 19 high around $59.45.
Additionally, $60.00 will be the key to watch beyond $59.45 as it holds the gate to the energy benchmark’s rise to September month top surrounding $63.13.
WTI four-hour chart
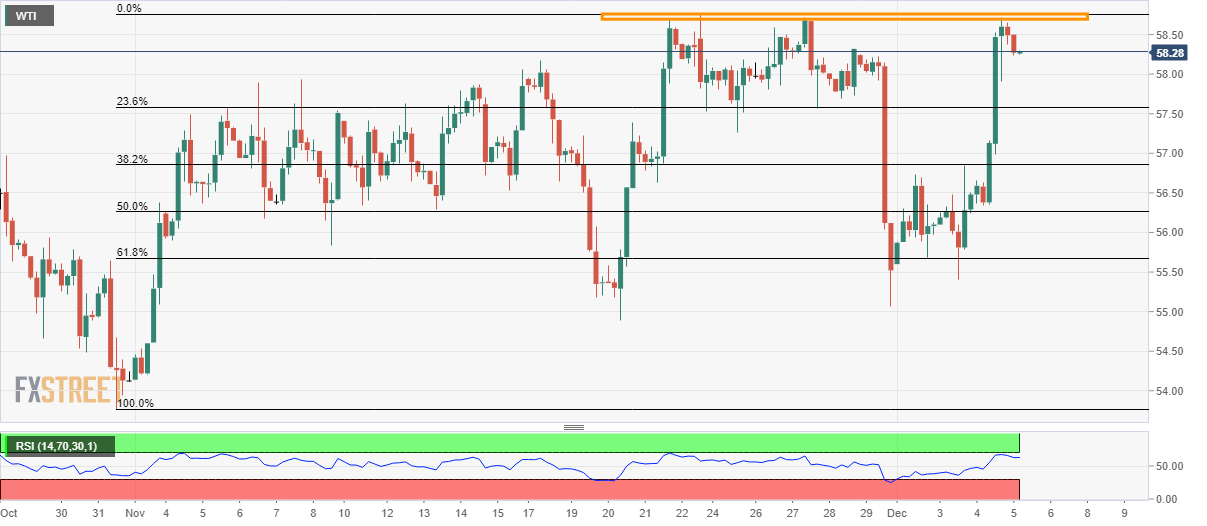
Trend: Pullback expected
