- AUD/USD holds on to recovery gains while following the immediate technical pattern.
- 61.8% and 23.6% Fibonacci retracement levels seem the key to watch during the triangle’s either side break.
- Steady RSI, sustained trading beyond 200-bar EMA keep buyers hopeful.
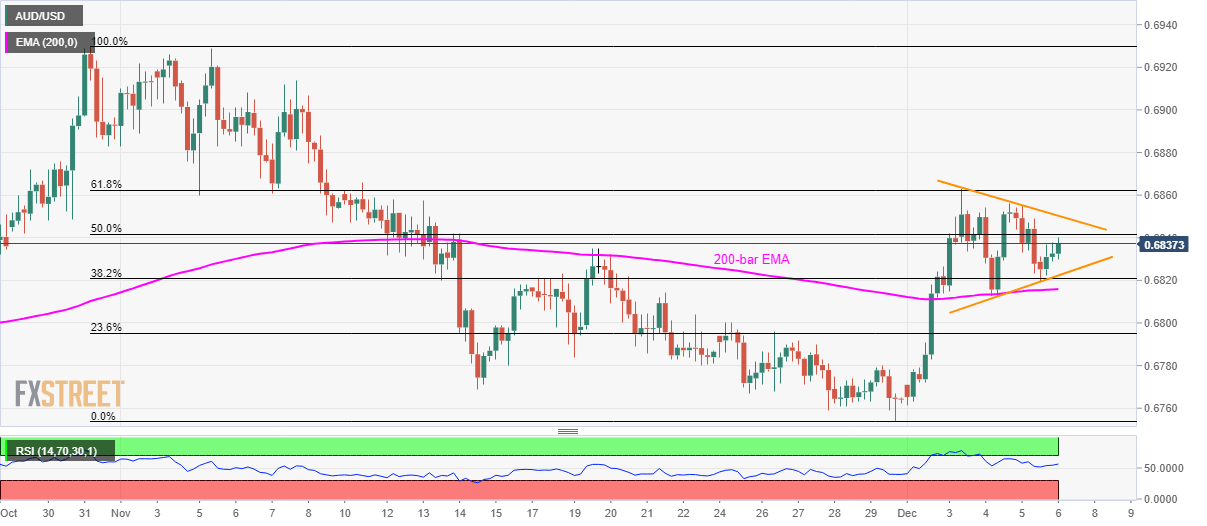
AUD/USD takes the bids to 0.6835 during Friday’s Asian session. The pair recently bounced off 200-bar Exponential Moving Average (EMA) and portrays a four-day-old symmetrical triangle.
Given the pair’s latest U-turn and price-positive conditions of the 14-bar Relative Strength Index (RSI), the quote is rising towards the pattern’s resistance line, at 0.6850 now. However, pair’s further advances could be confined by 61.8% Fibonacci retracement of October-November downpour, near 0.6865.
In a case where prices keep upside momentum intact beyond 0.6865, November 07 high around 0.6915 and October-end top surrounding 0.6925 will be in focus.
On the downside, the triangle’s support around 0.6820 and 200-bar EMA level of 0.6815 can limit the pair’s immediate declines ahead of highlighting 23.6% Fibonacci retracement level close to 0.6795.
While assuming pair’s further weakness below 0.6795, November month low of 0.6754 will be on the Bears’ radar.
AUD/USD Technical Analysis
Trend: Sideways
